| |
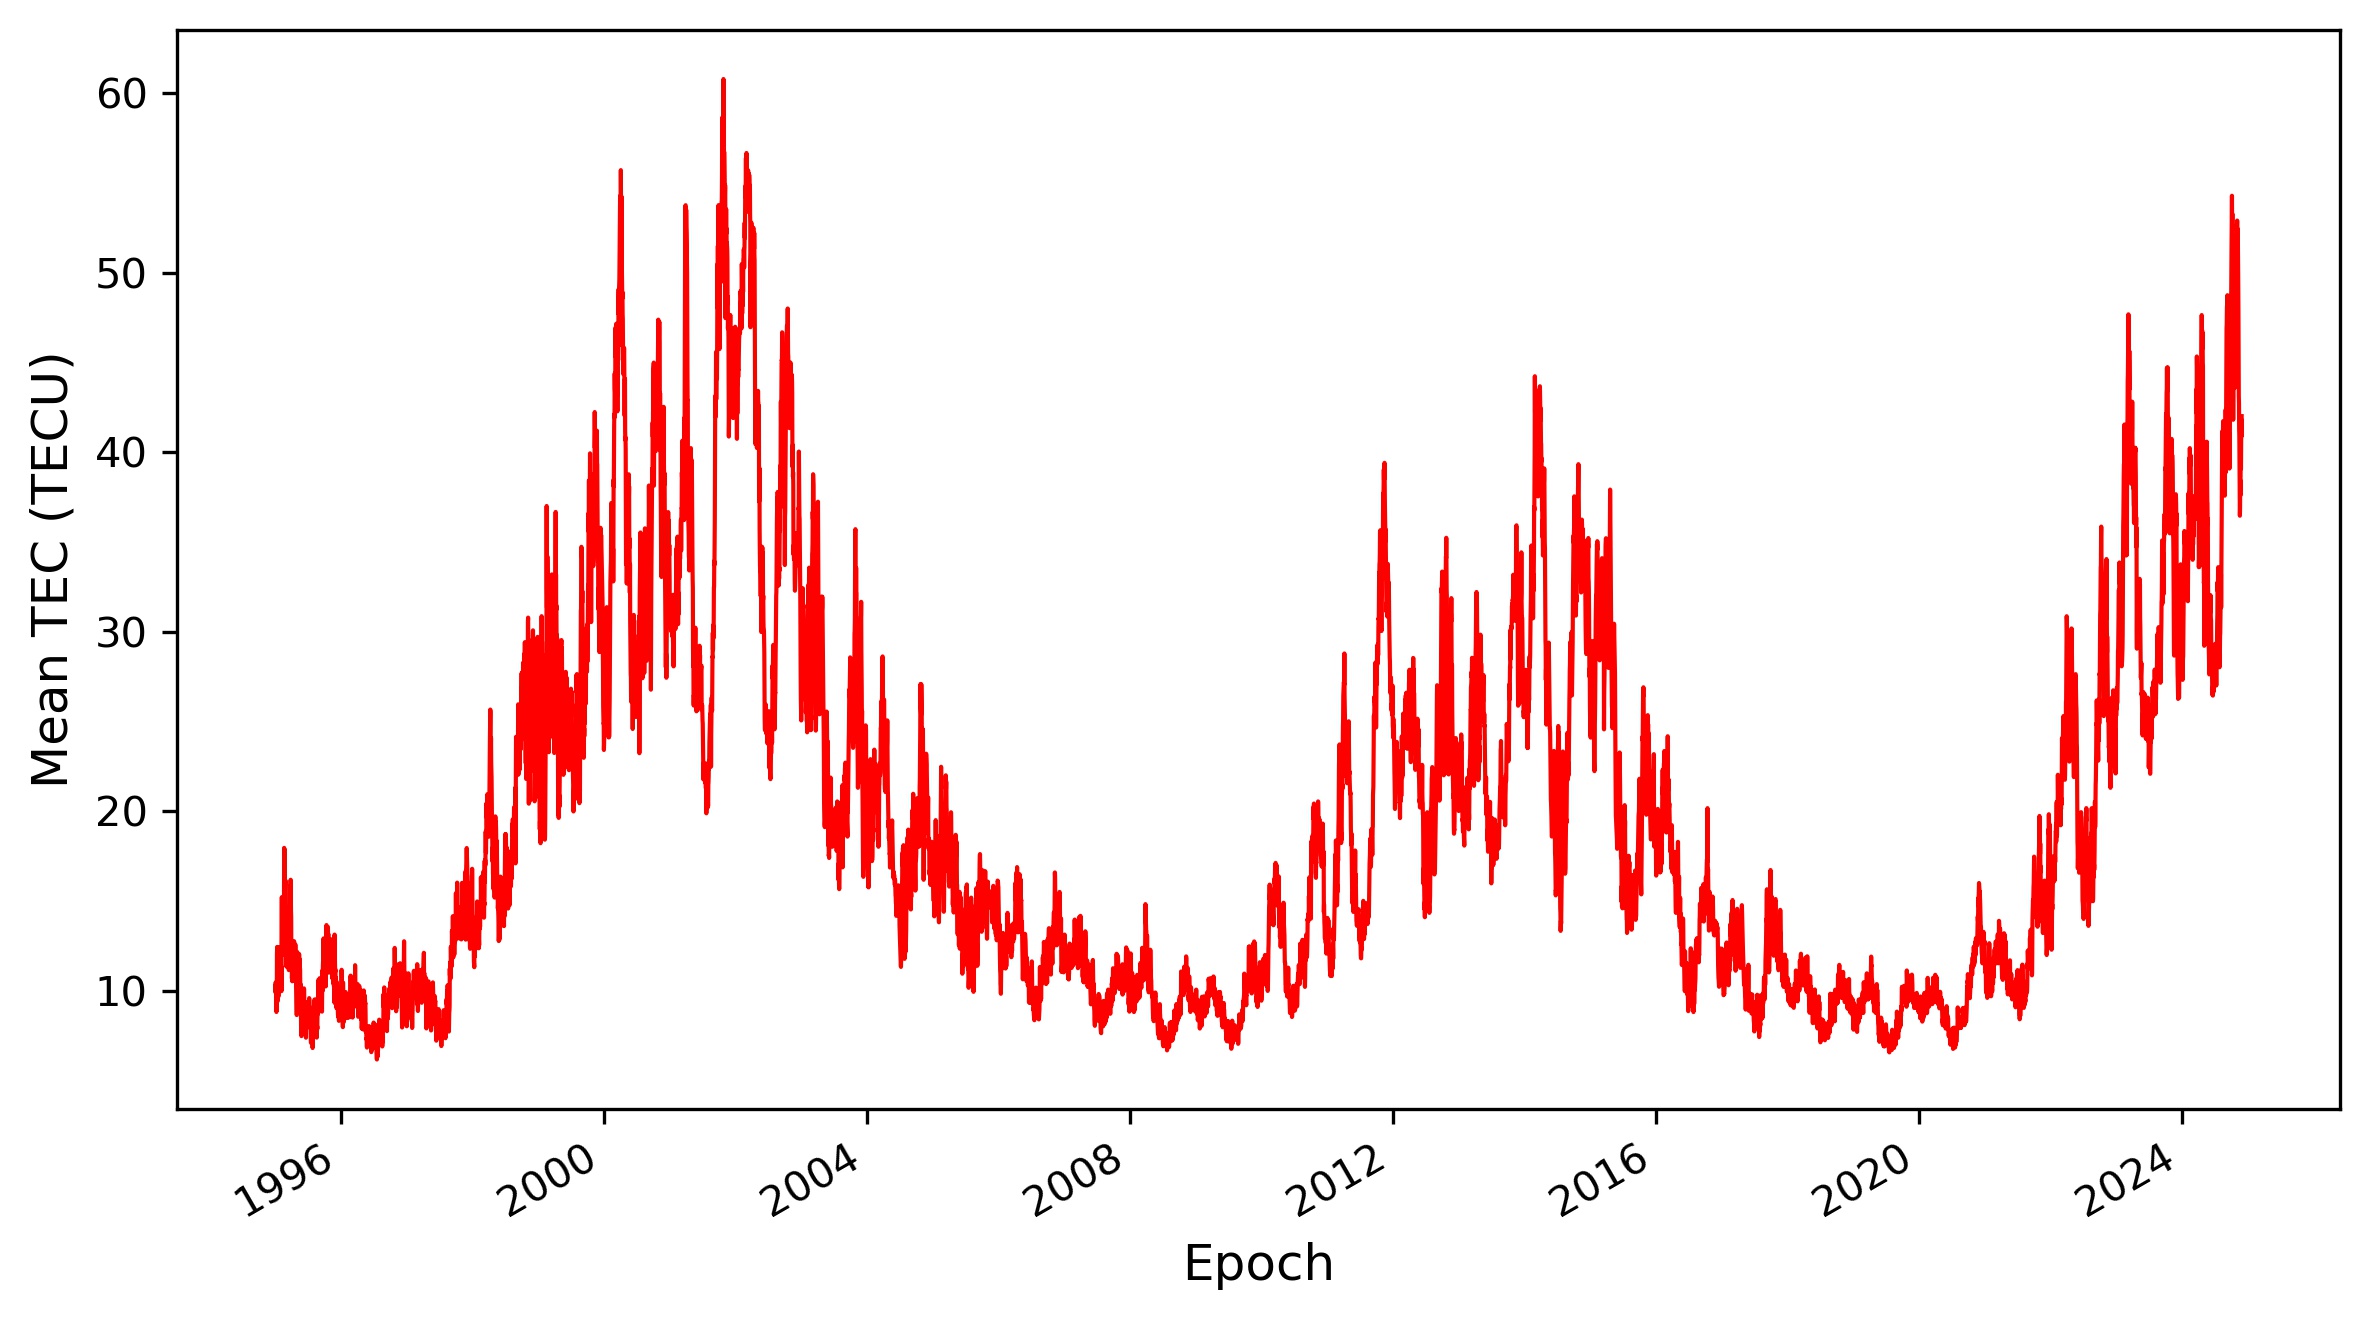
| Ionosphere mean-TEC: | Long-term series (generated by RAPIONO) |
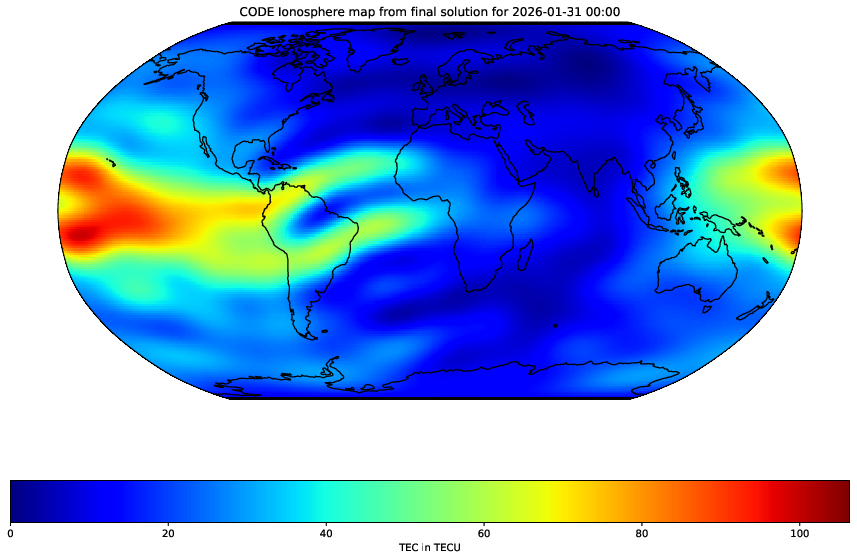
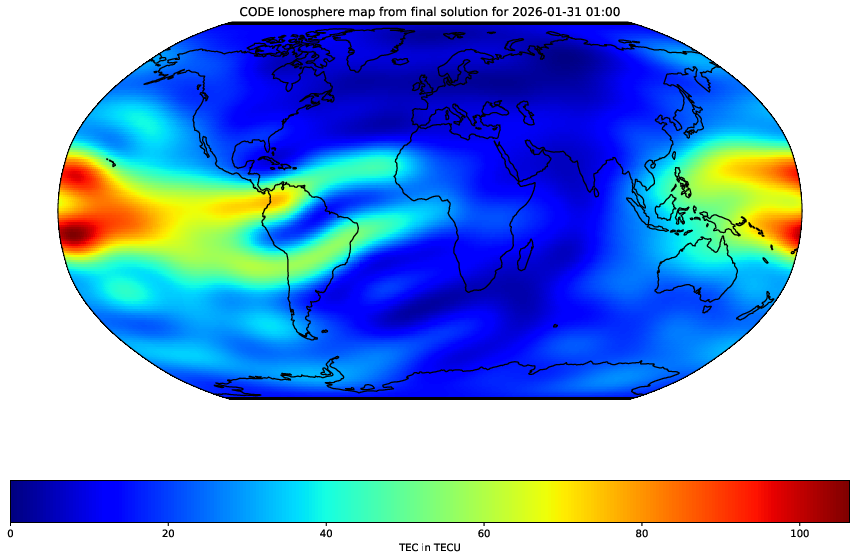
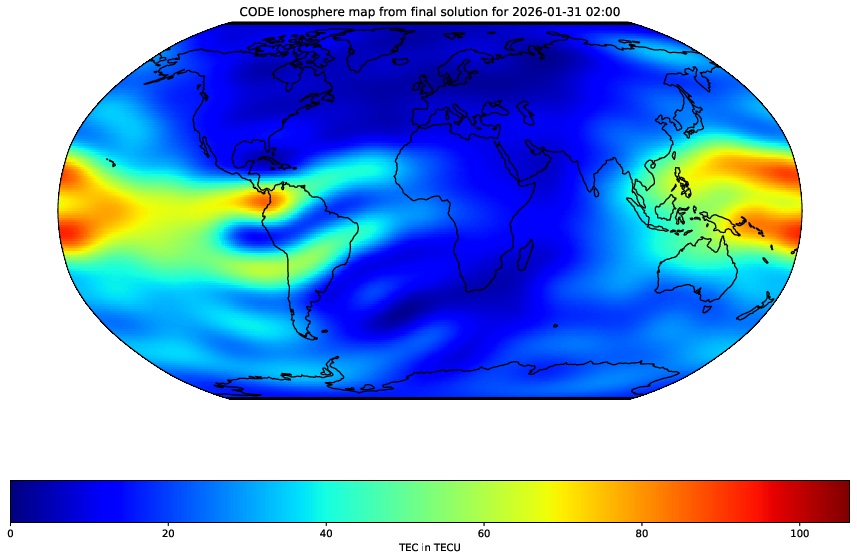
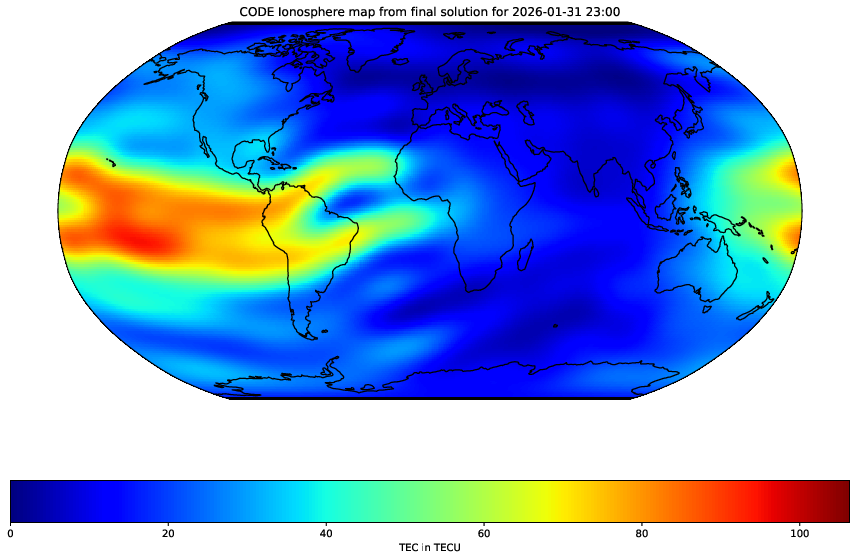
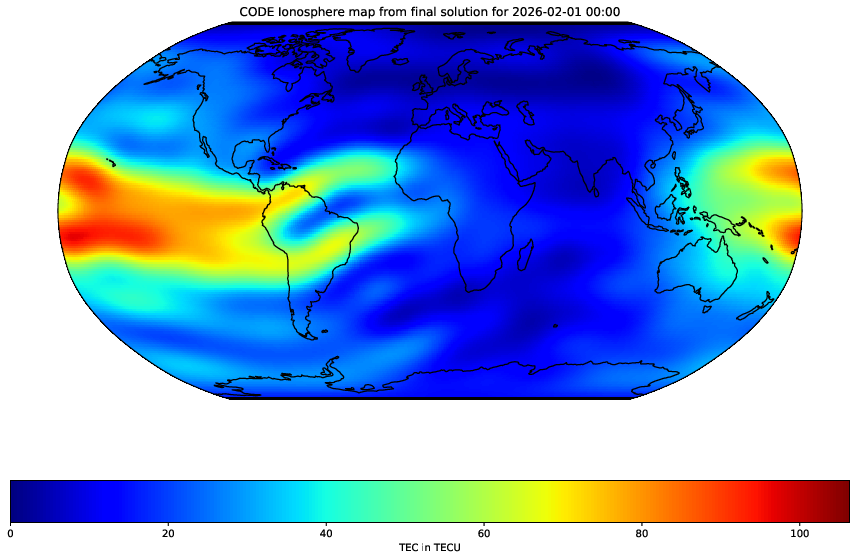
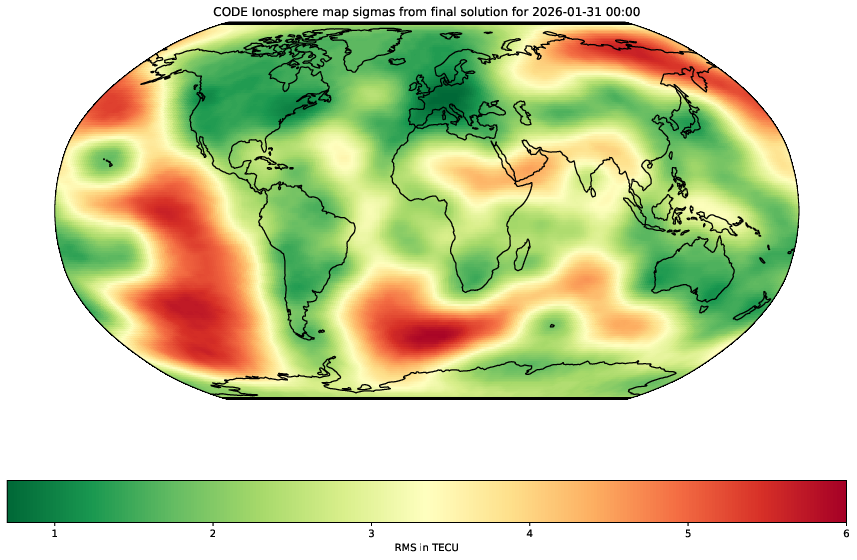
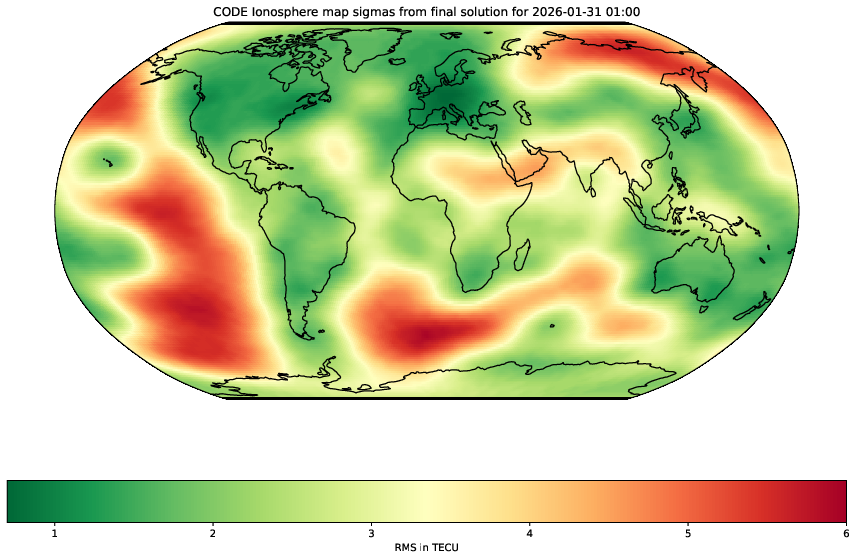
| Ionosphere maps - final: | TEC map | sigma map | animated gif, one day | animated gif, three days |
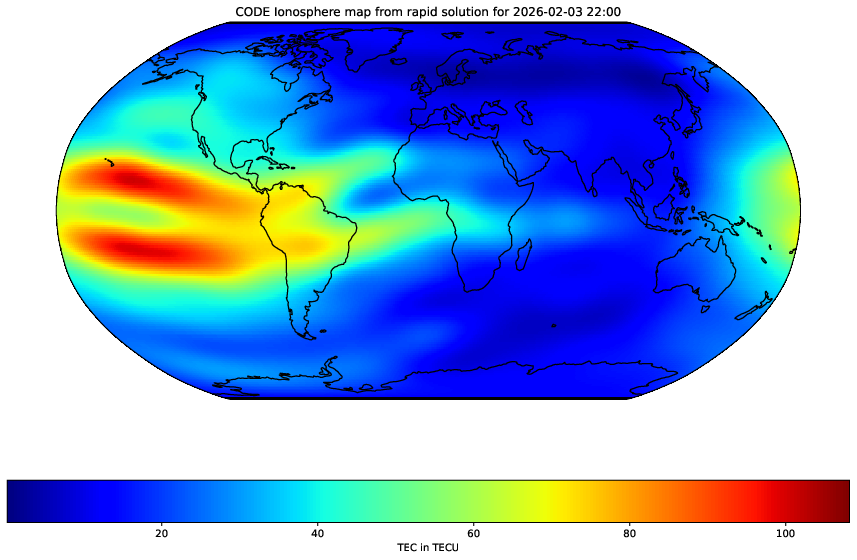
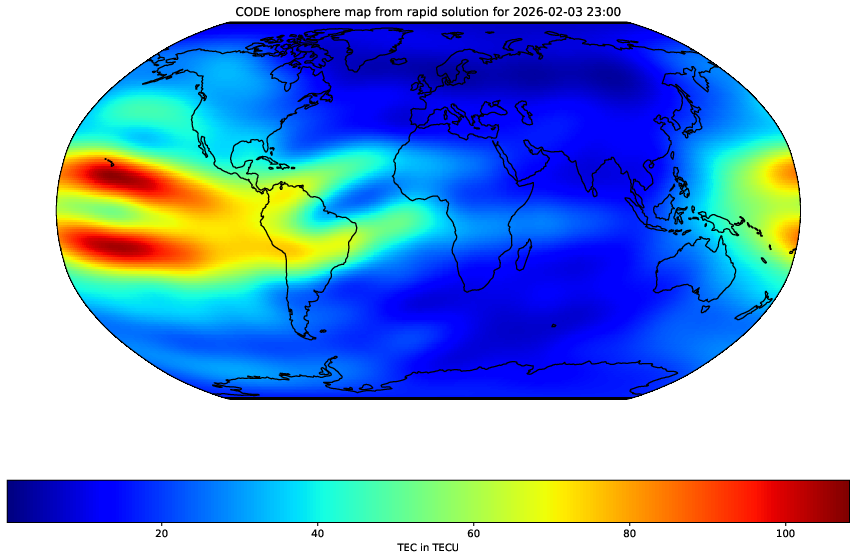
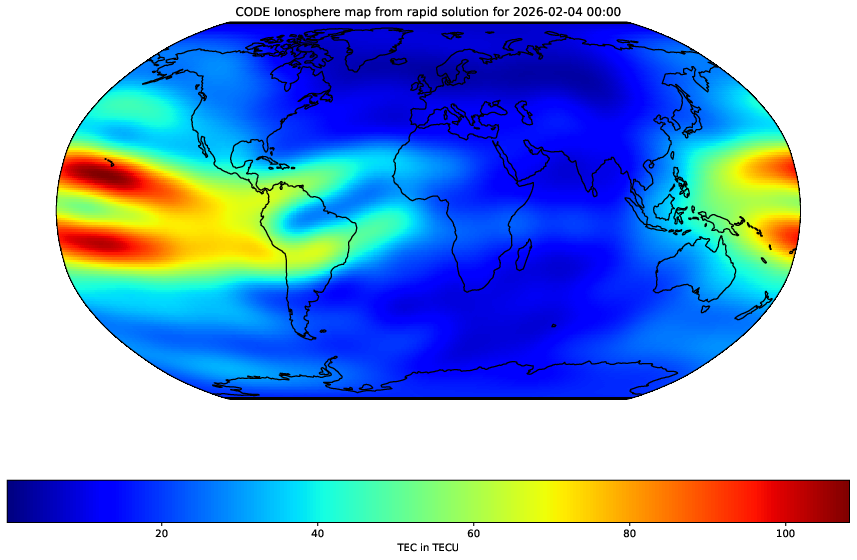
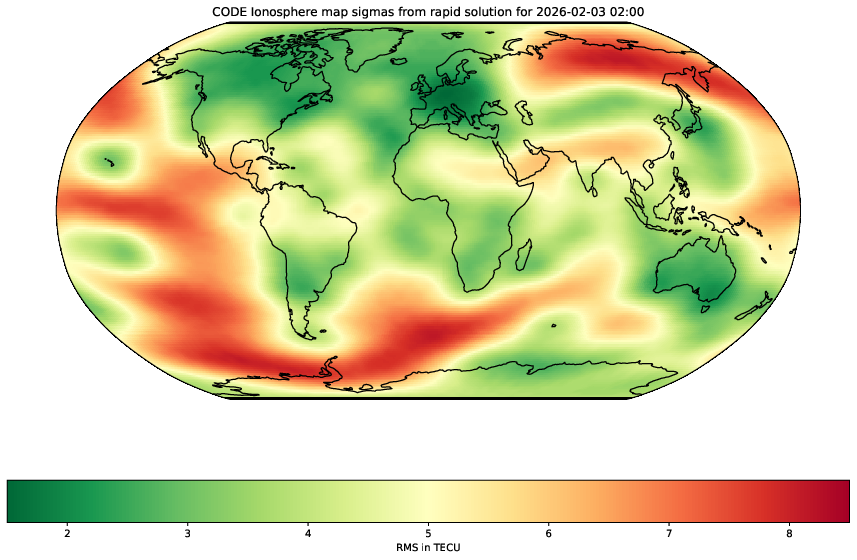
| Ionosphere maps - rapid: | TEC map | sigma map | animated gif, one day | animated gif, three days | mp4 |
| Comparison final/rapid solution | Differences: animated gif |
| Statistics: mean | median | std.dev | IQR | |
| Historical Iono Event: | High activity May 9-12, 2024 (visible auroras across Europe) |
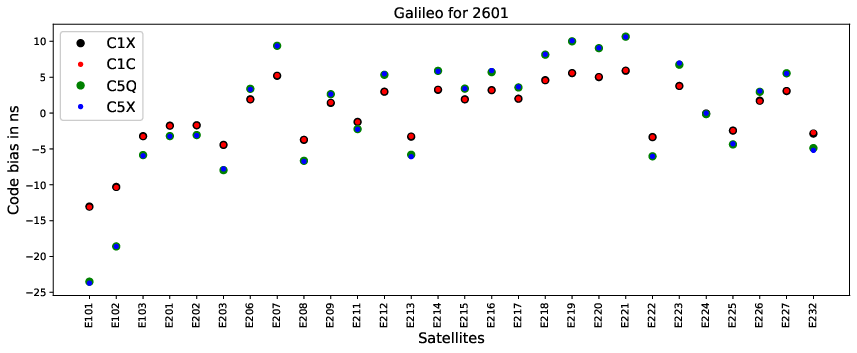
| IGSFINAL - Monthly mean OSBs: | GPS | GLO | GAL |
|
|
Ionosphere mean-TEC: Long-term series
|
|
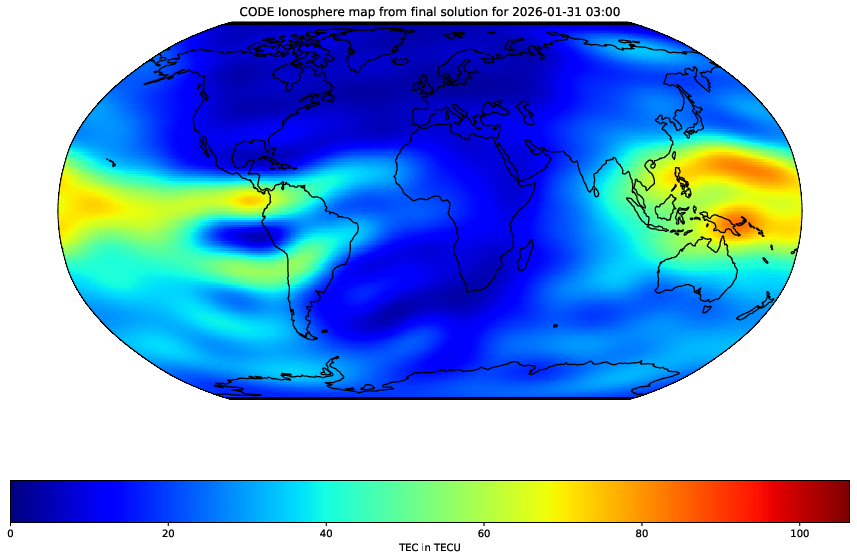
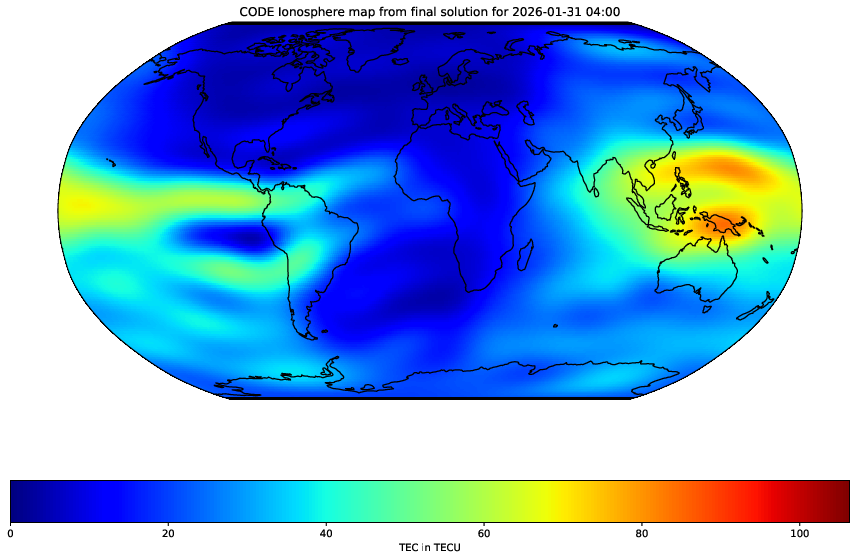
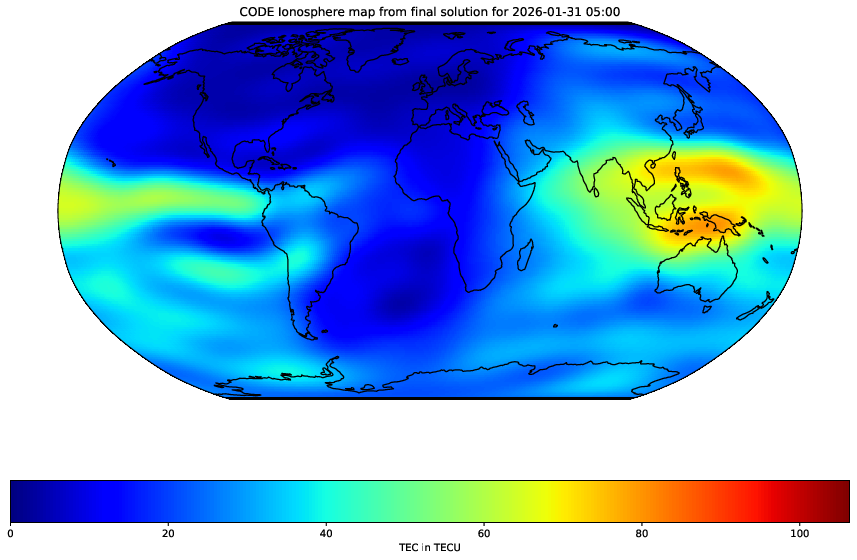
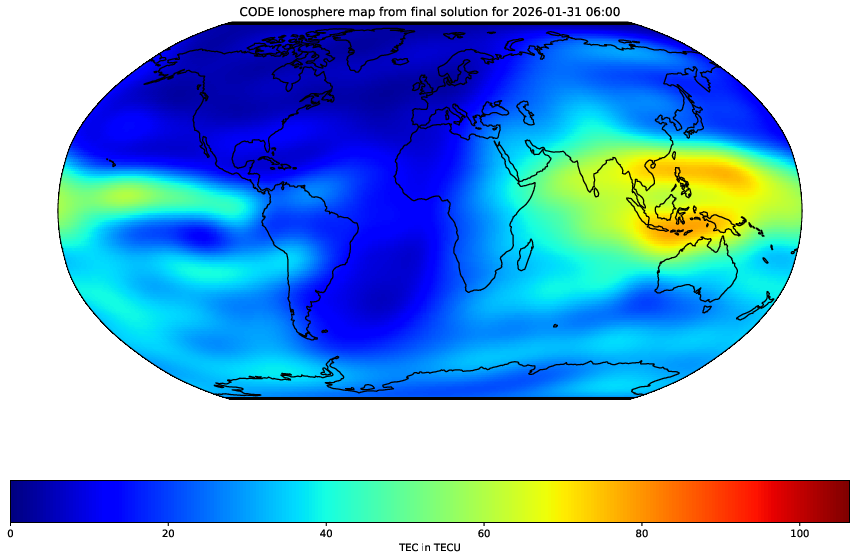
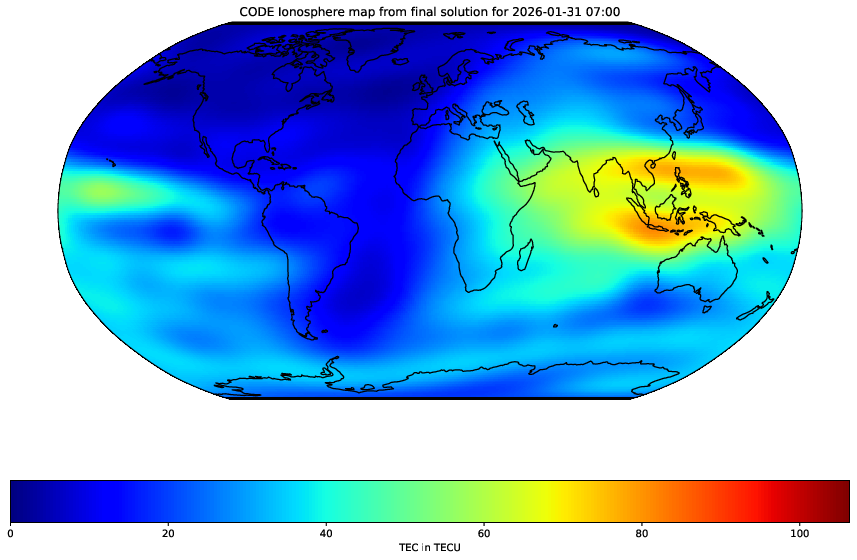
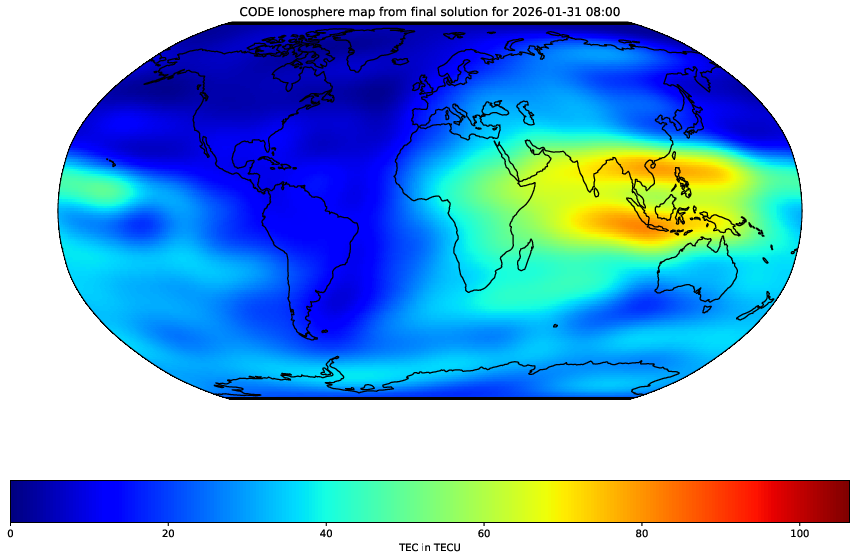
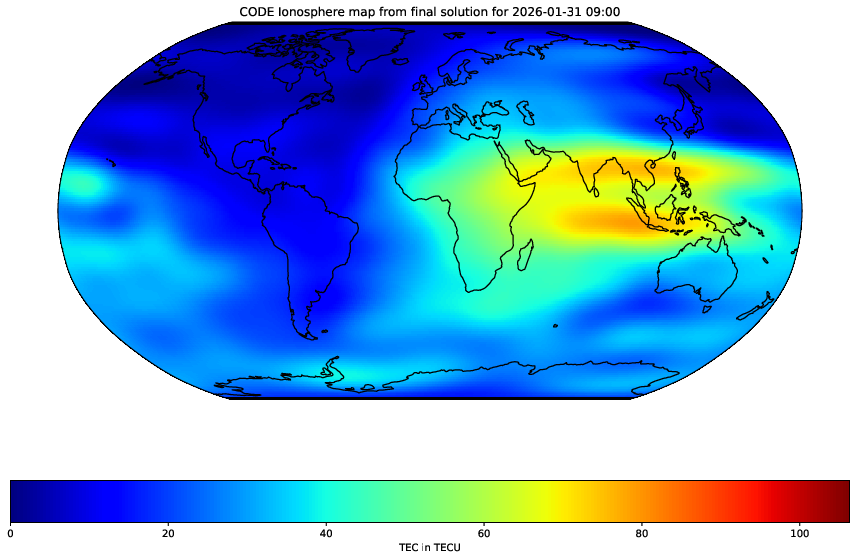
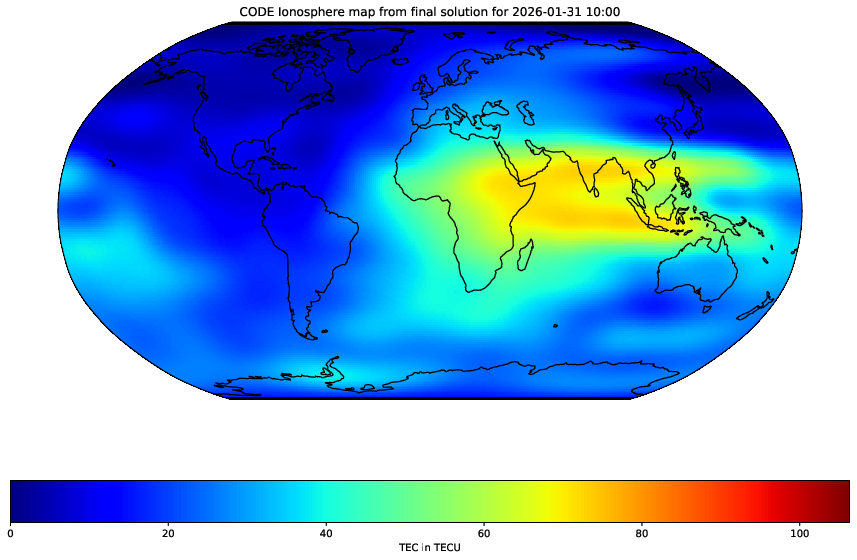
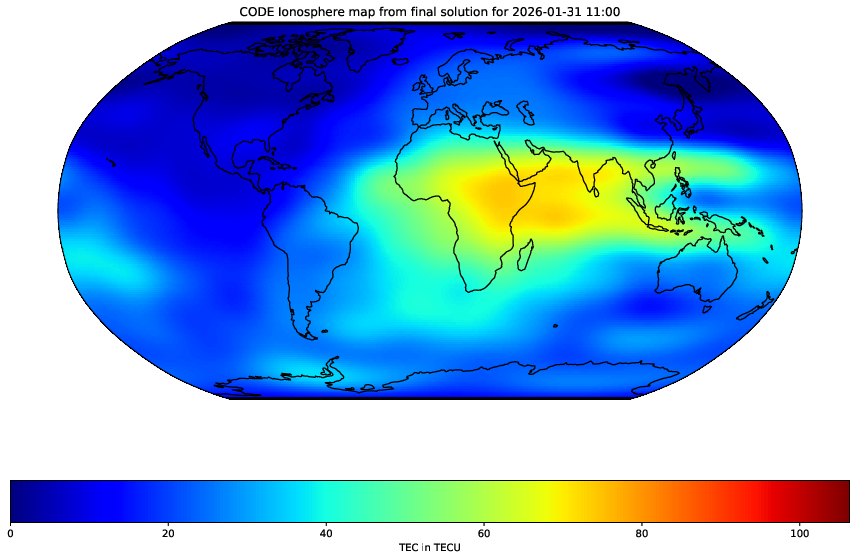
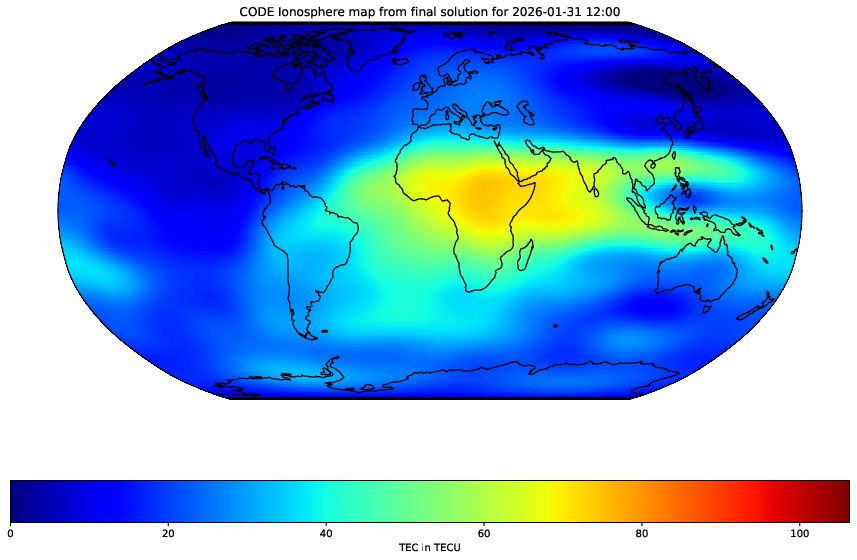
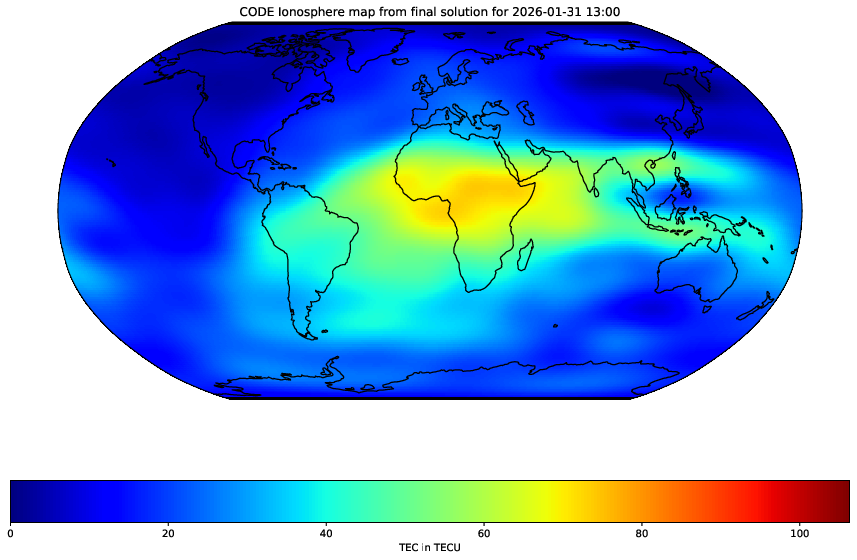
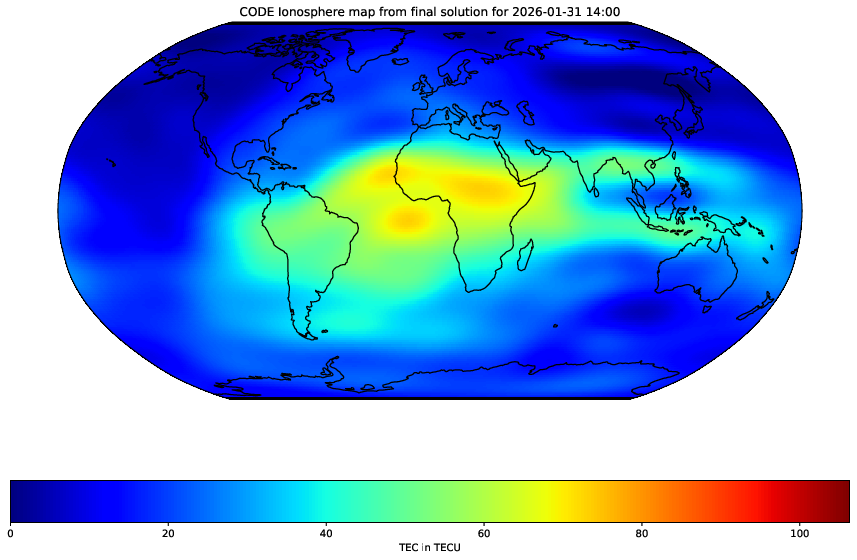
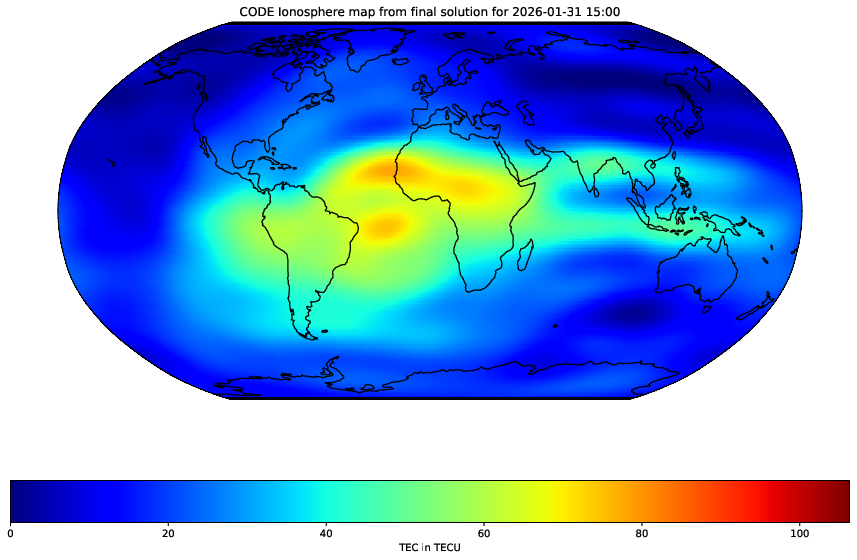
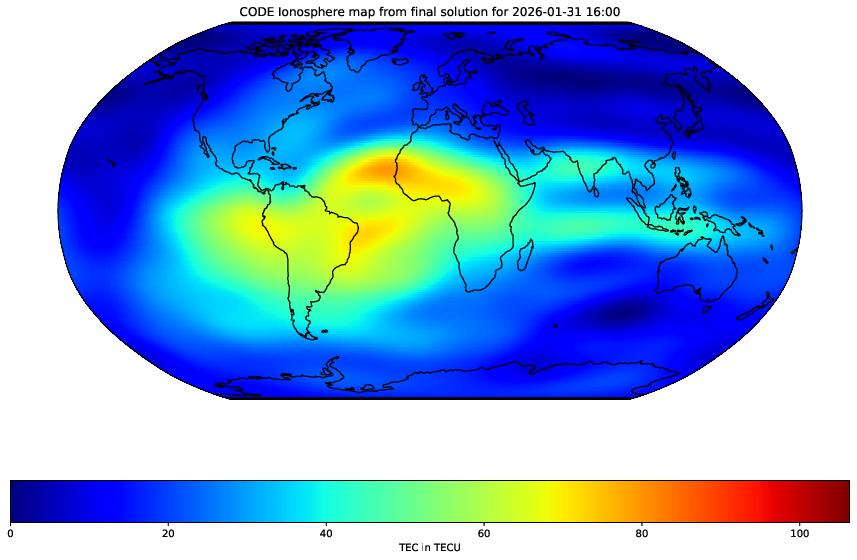
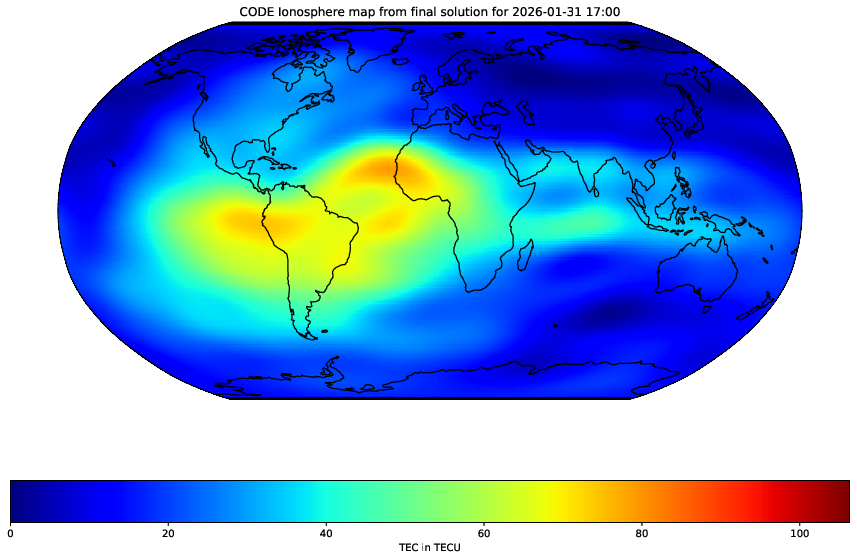
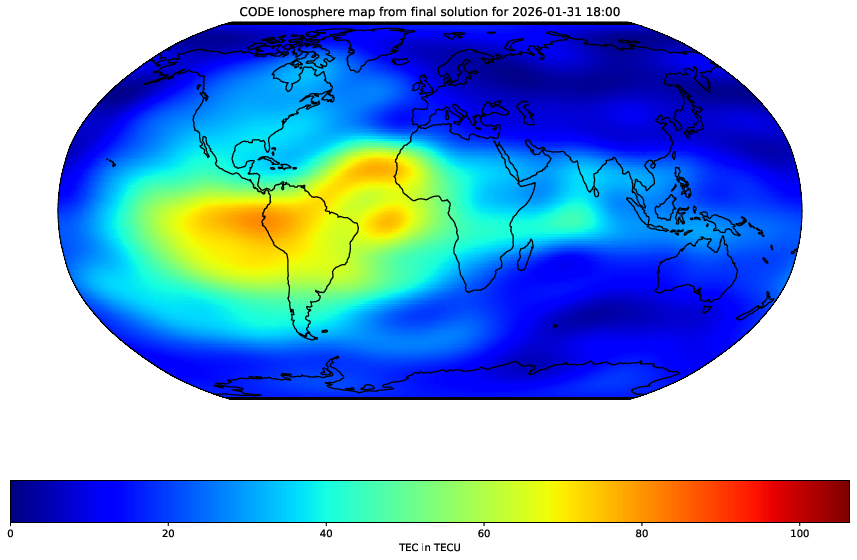
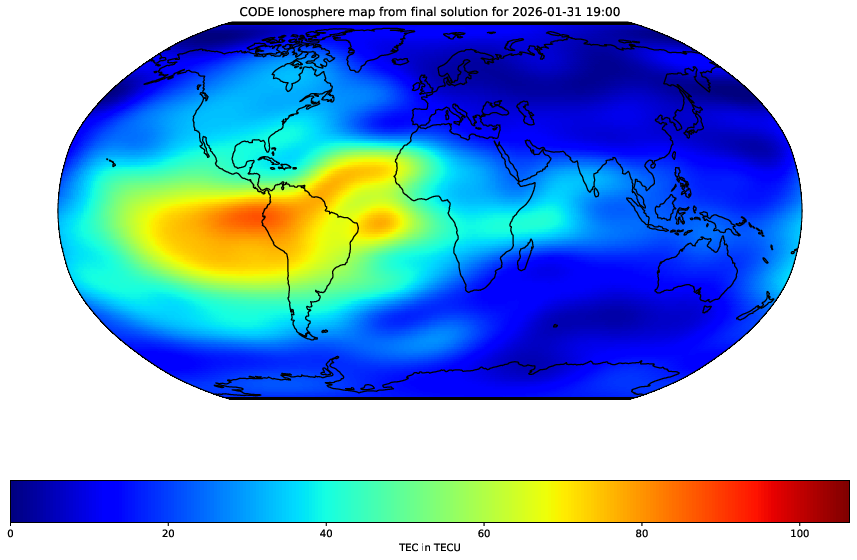
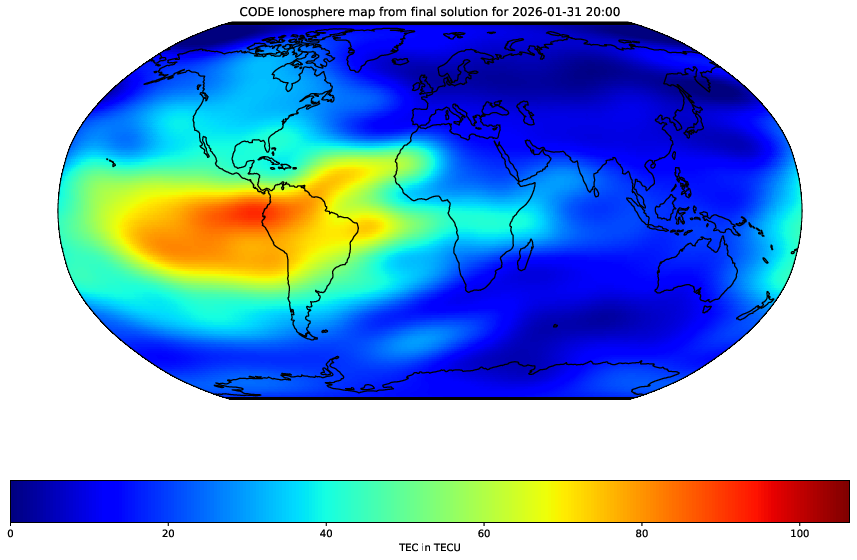
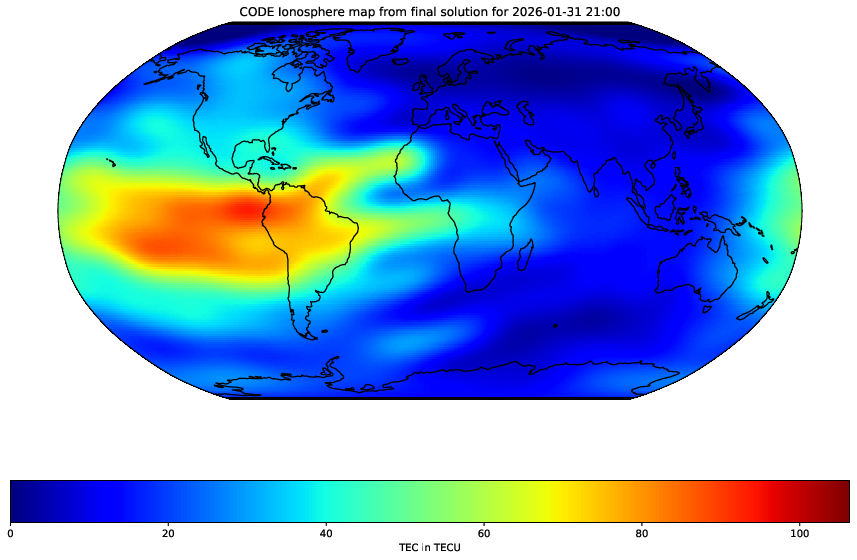
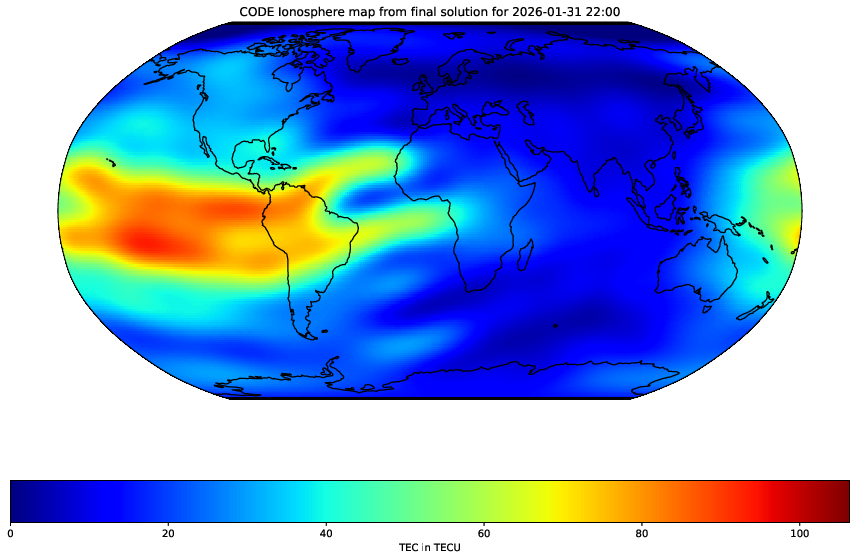
Ionosphere maps - final: TEC map (00:00-24:00)
|
|
|
|
|
|
|
|
|
|
|
|
|
|
|
|
|
|
|
|
|
|
|
|
|
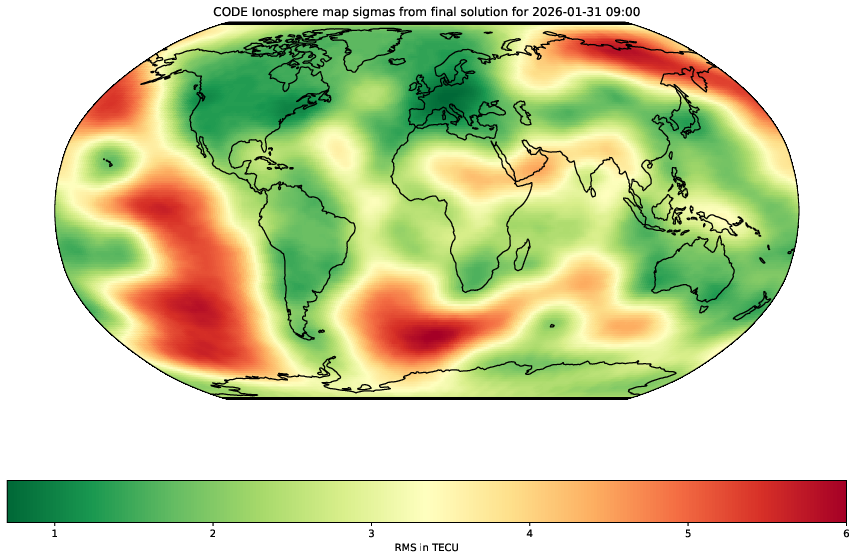
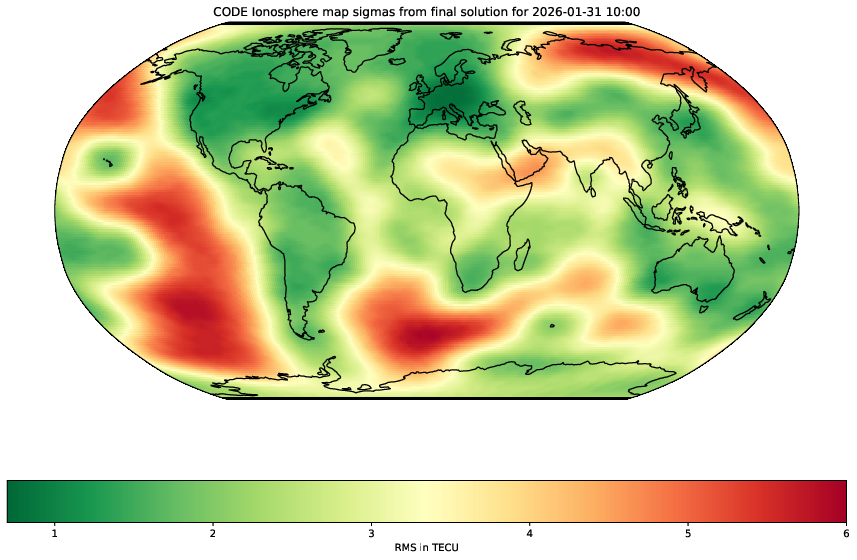
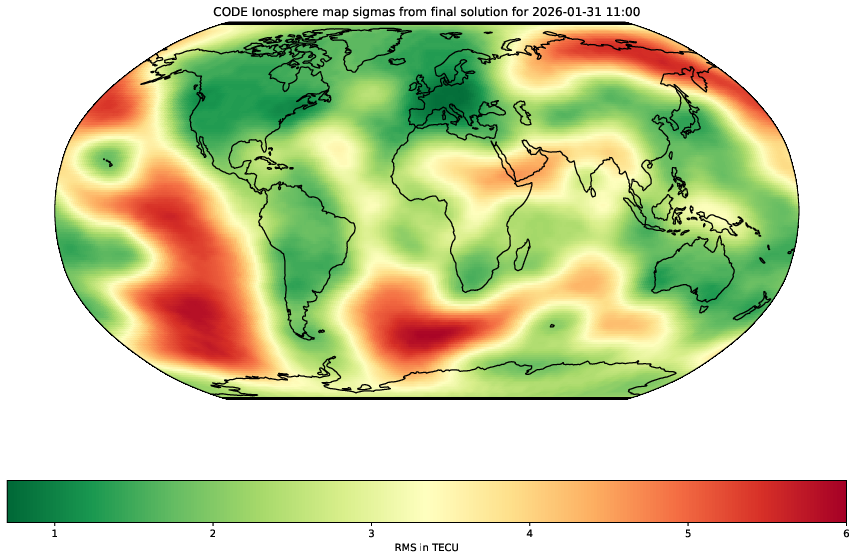
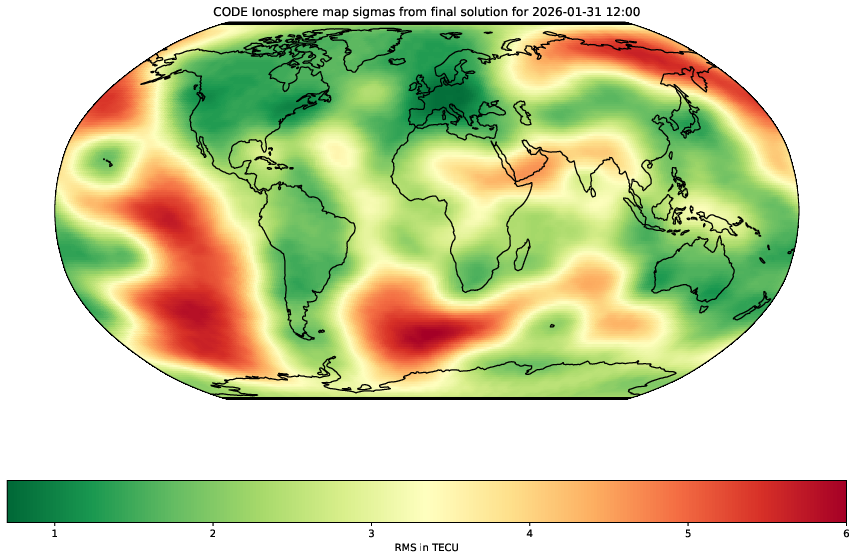
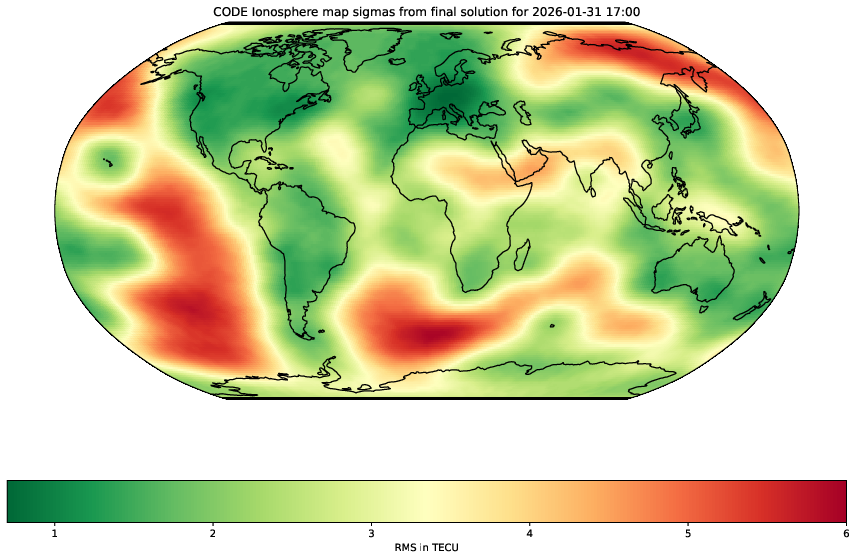
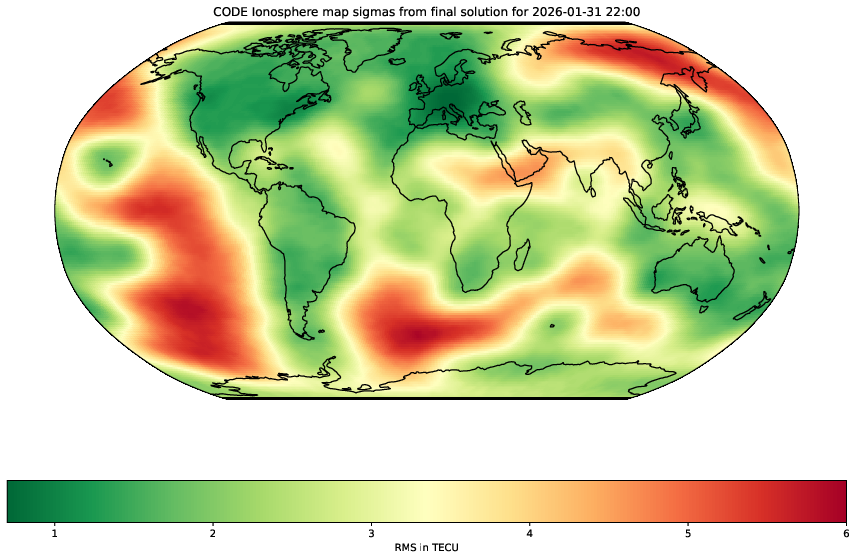
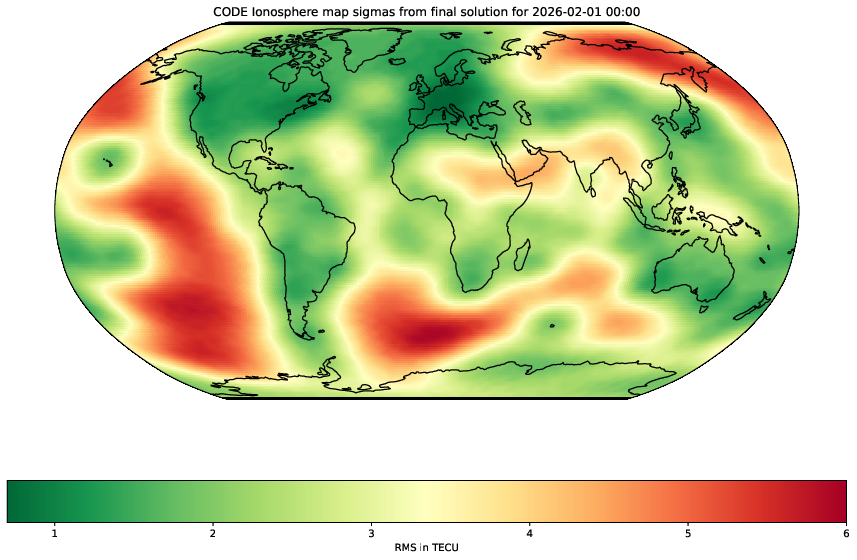
Ionosphere maps - final: sigma values (00:00-24:00)
|
|

|

|

|

|

|

|

|
|
|
|
|

|

|

|

|
|

|

|

|

|
|

|
|
Ionosphere maps - final: animated GIFs -- one day (TEC values)
Ionosphere maps - final: animated GIFs -- one day (sigma values)
Ionosphere maps - final: animated GIFs -- three days (TEC values)
|
|
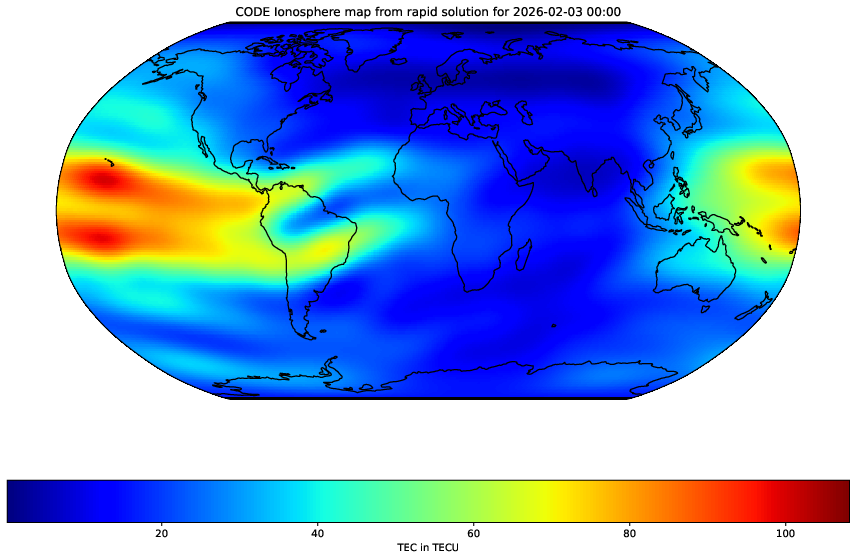
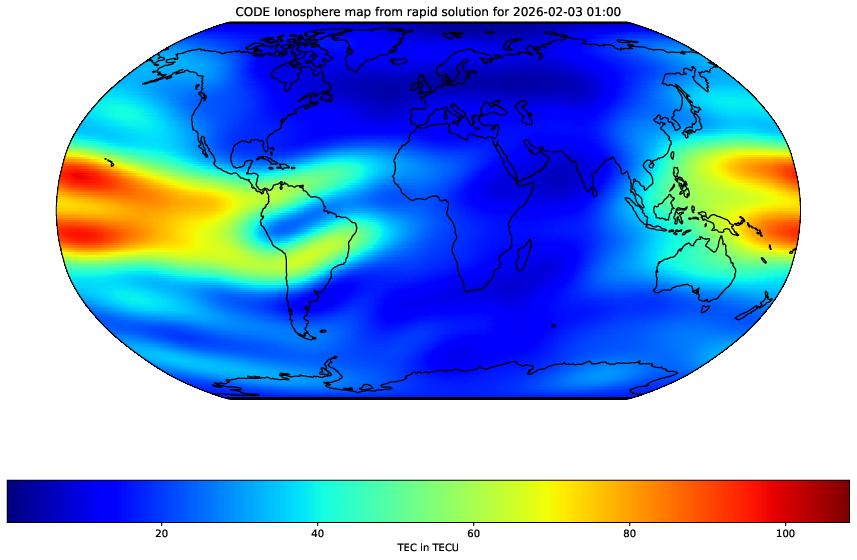
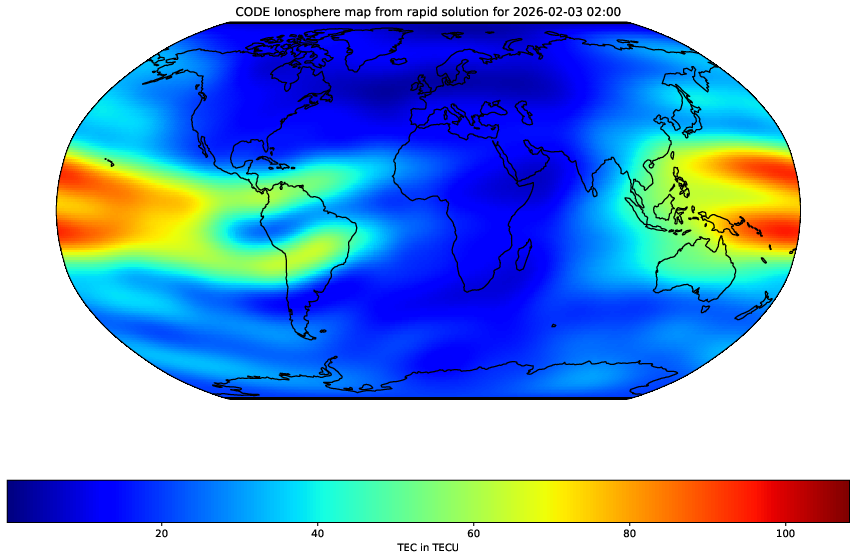
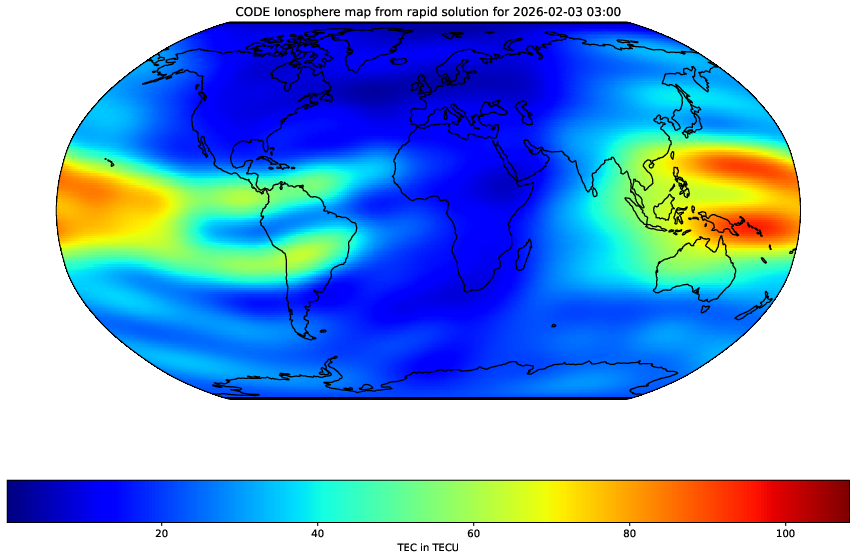
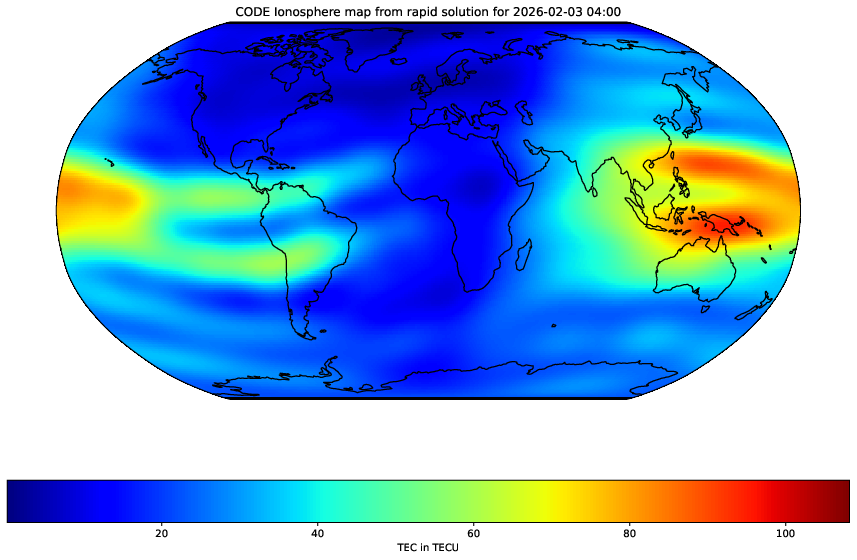
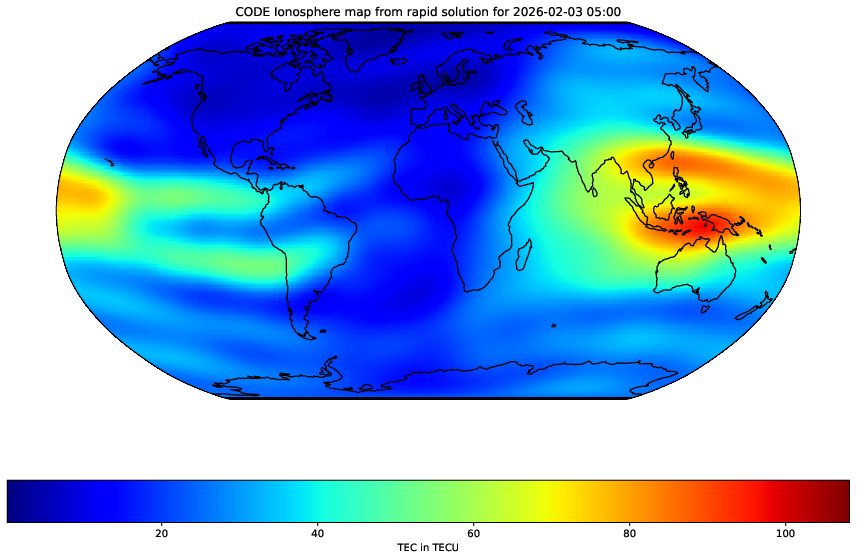
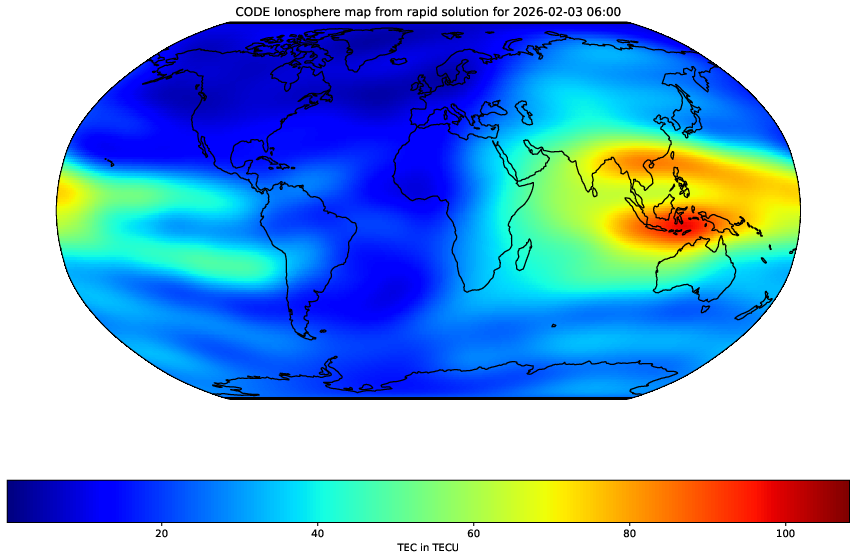
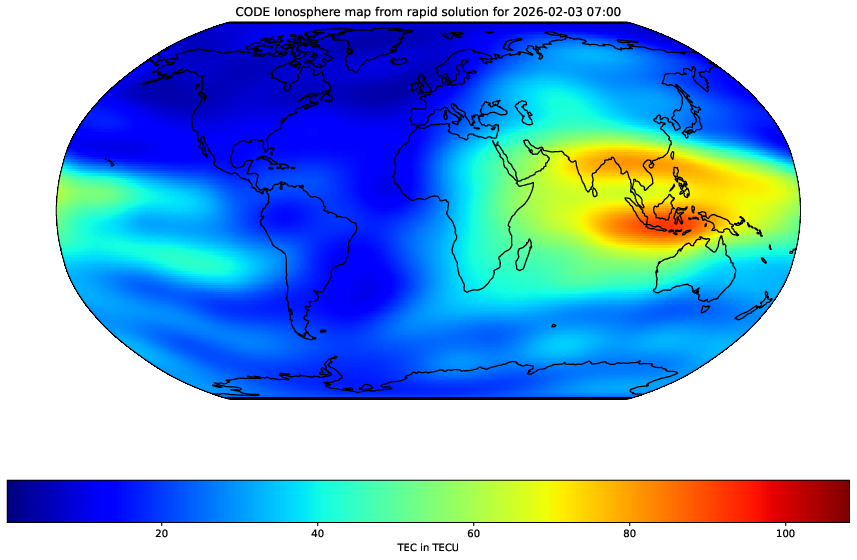
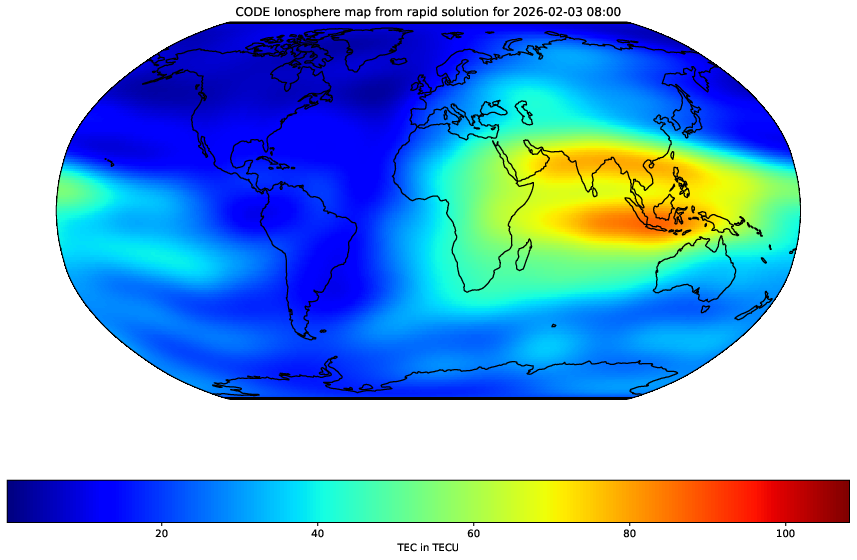
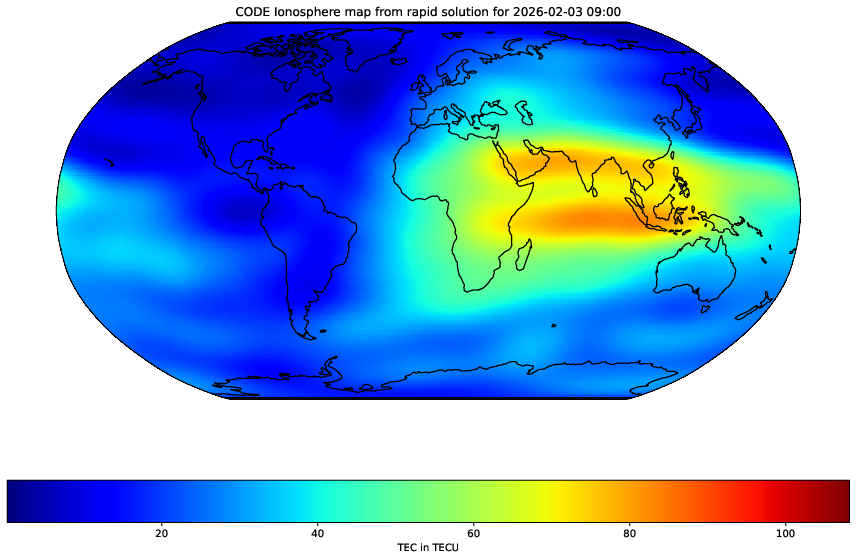
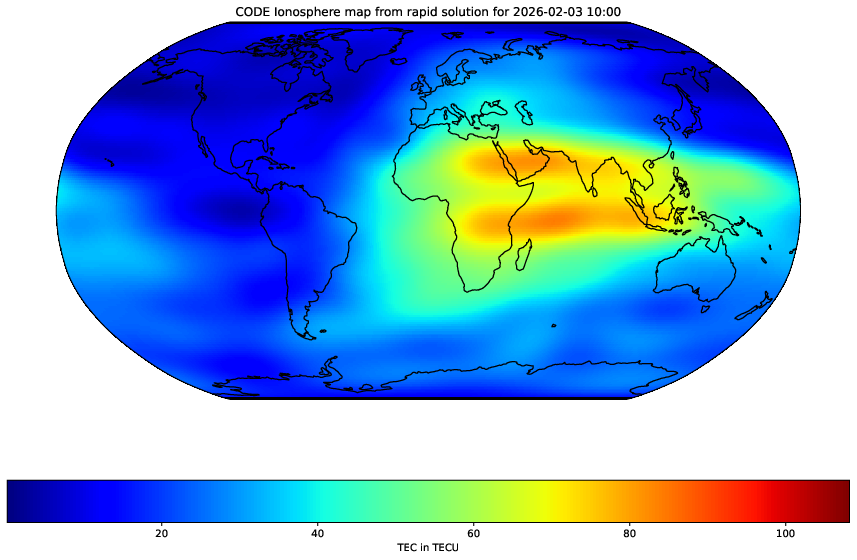
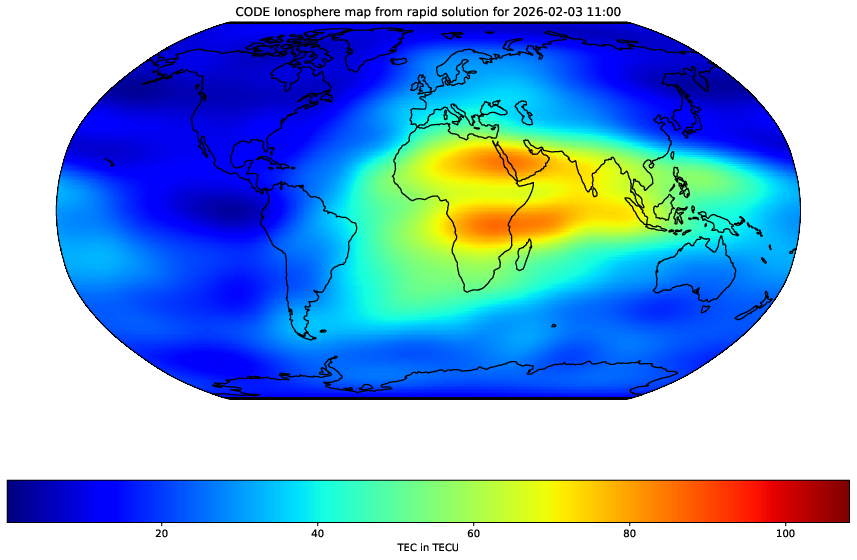
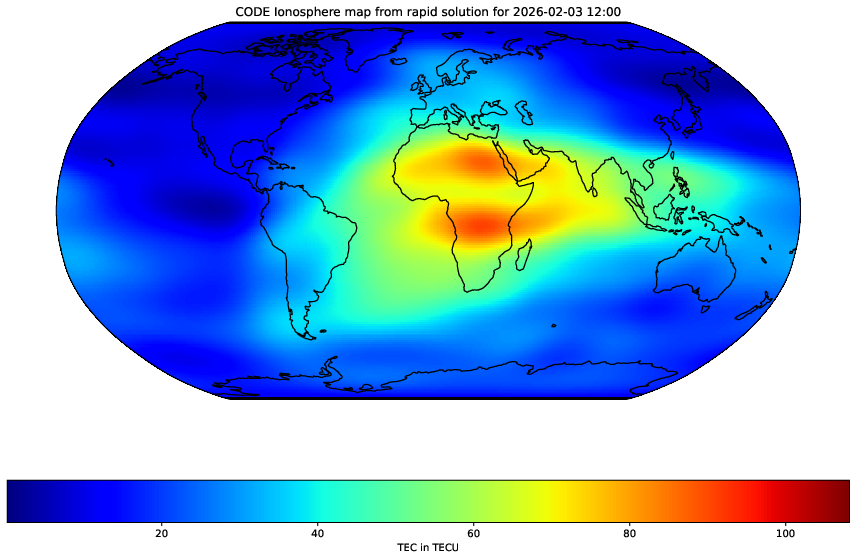
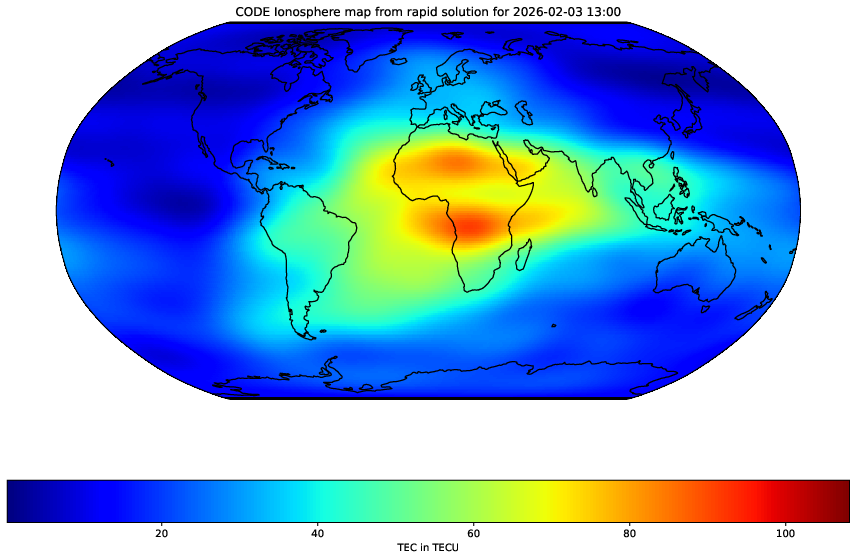
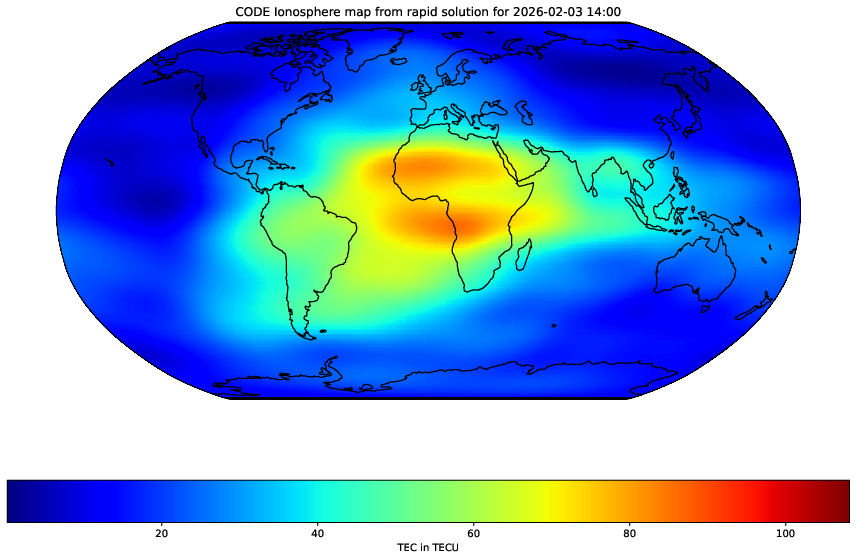
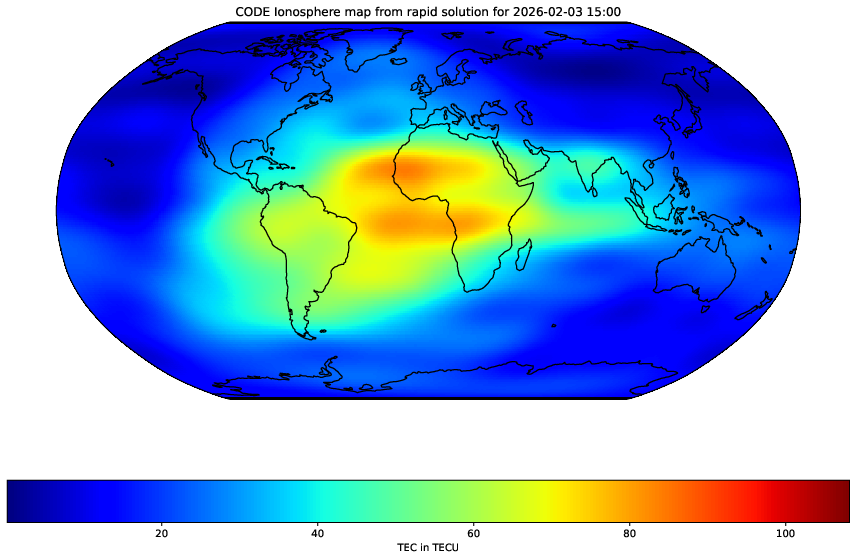
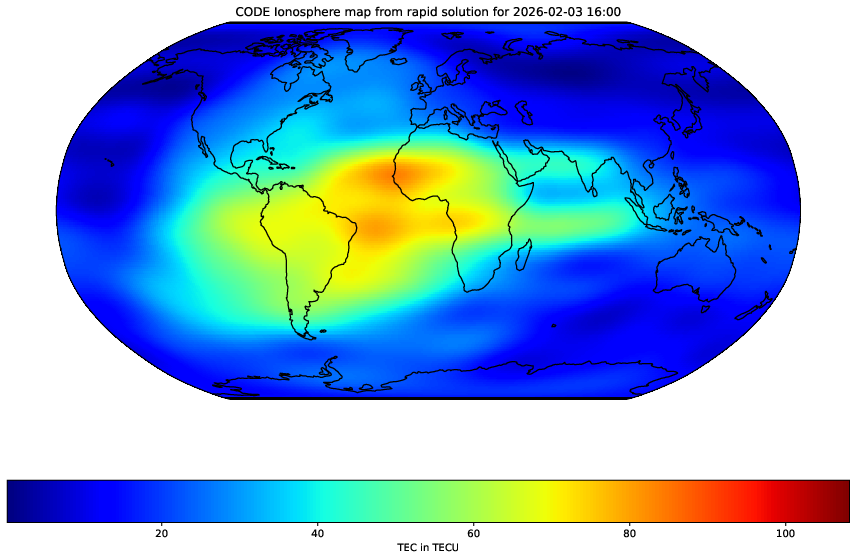
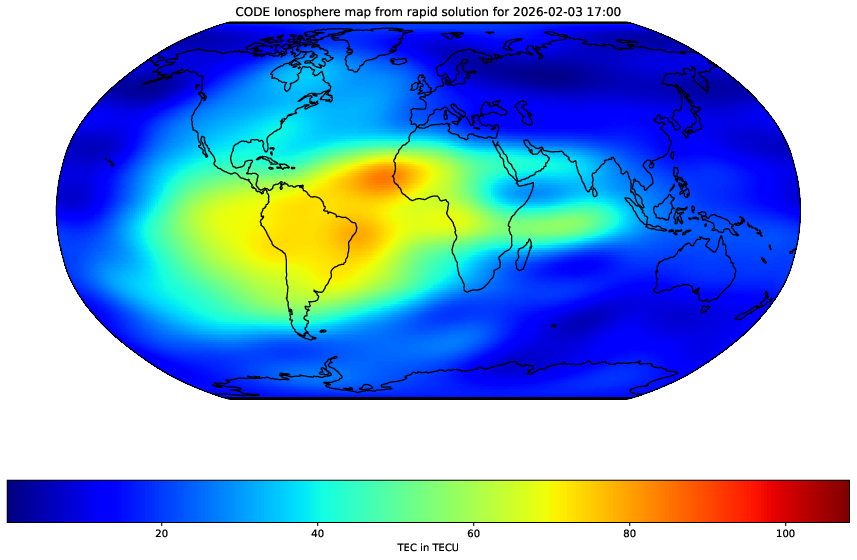
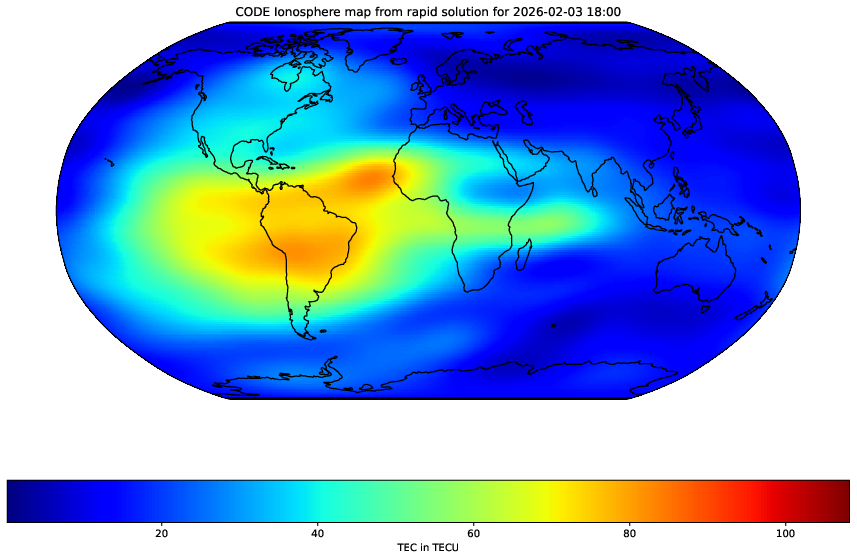
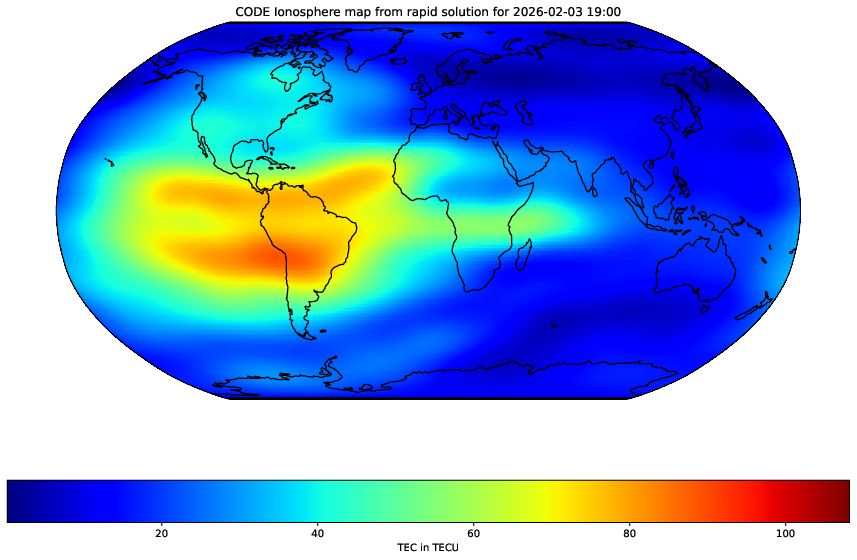
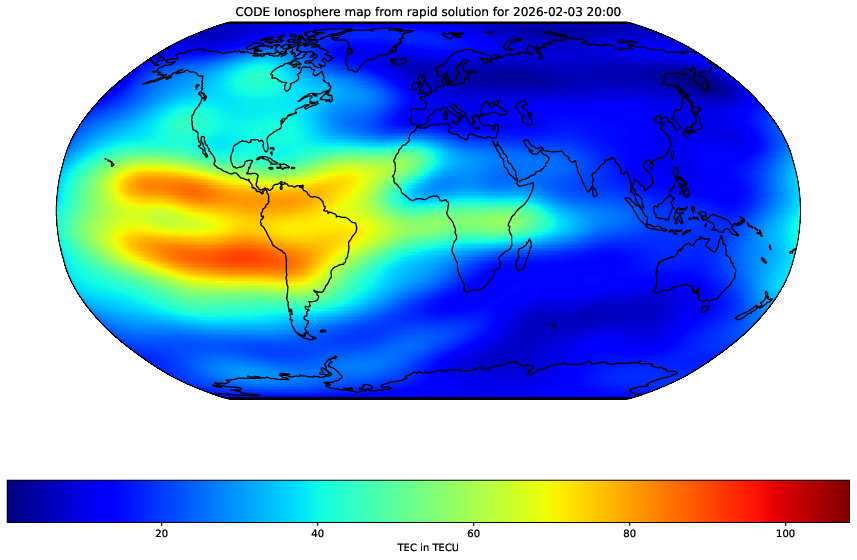
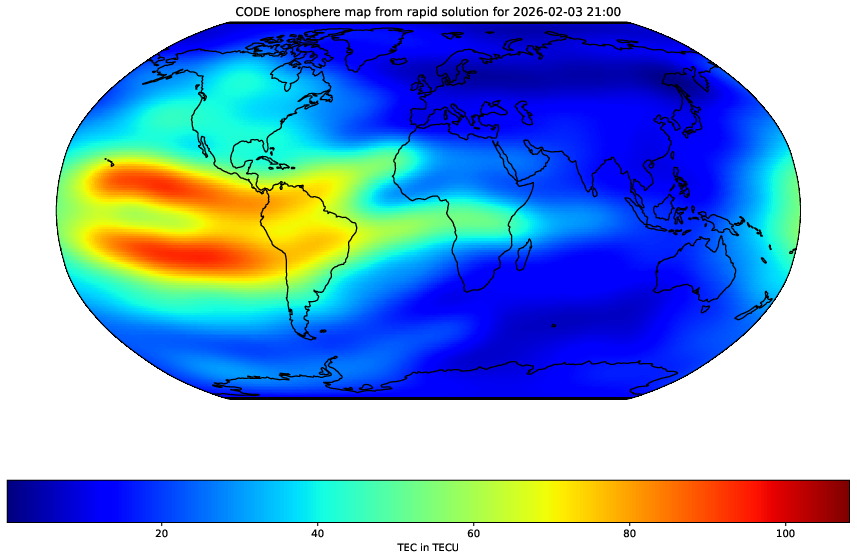
Ionosphere maps - rapid: TEC values (00:00-24:00)
|
|
|
|
|
|
|
|
|
|
|
|
|
|
|
|
|
|
|
|
|
|
|
|
|
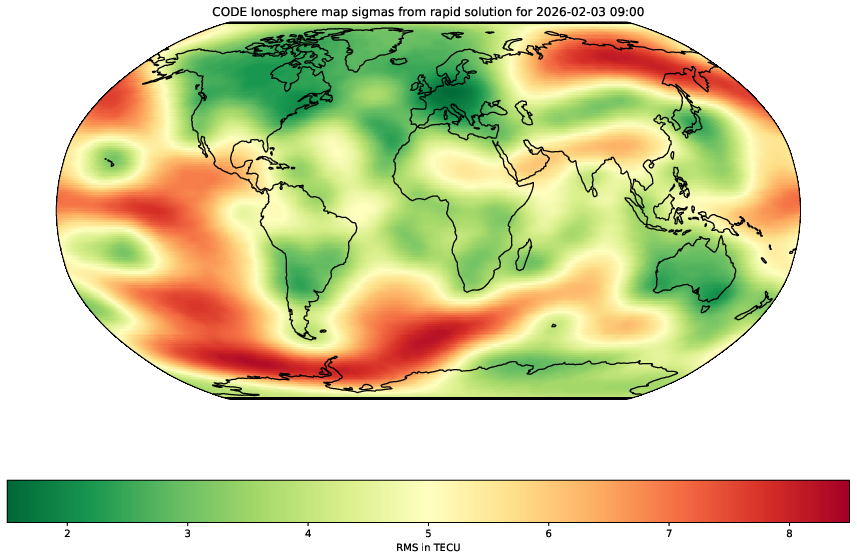
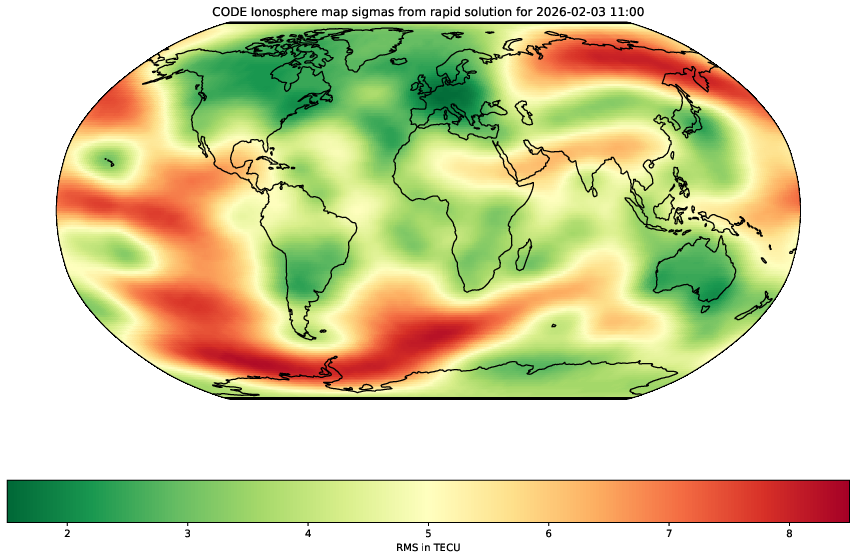
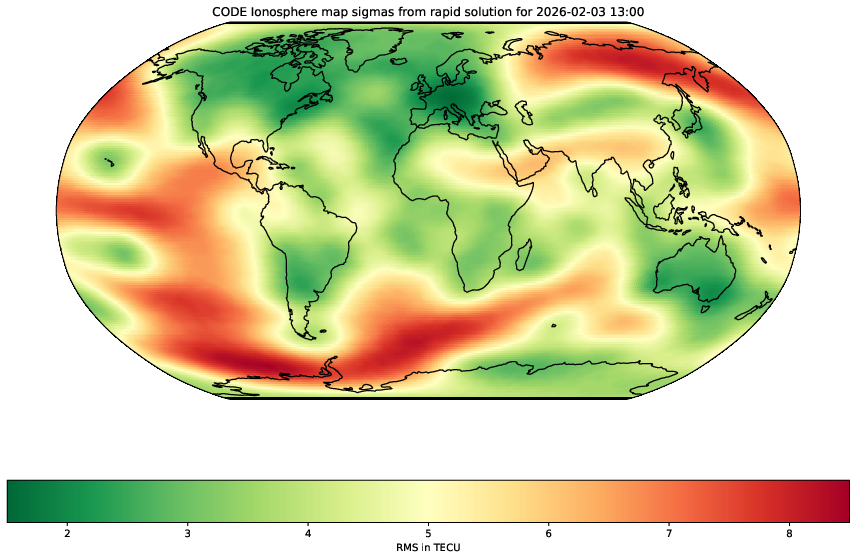
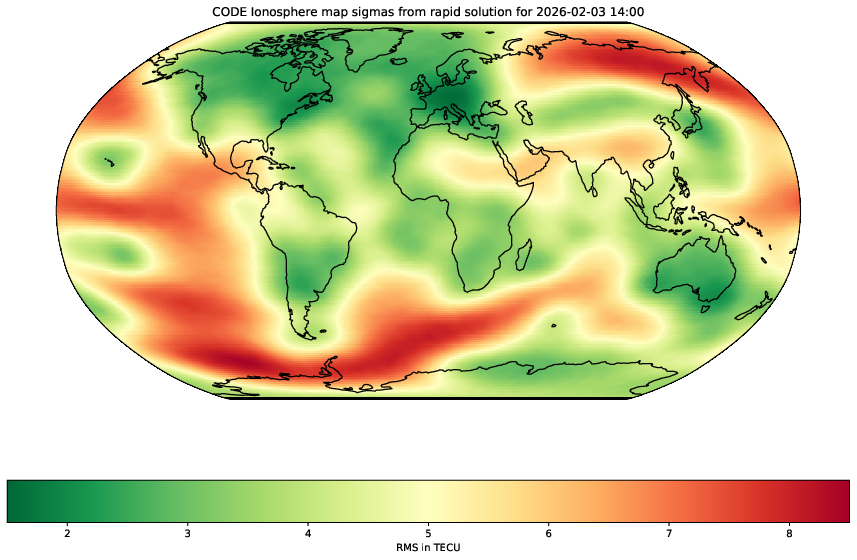
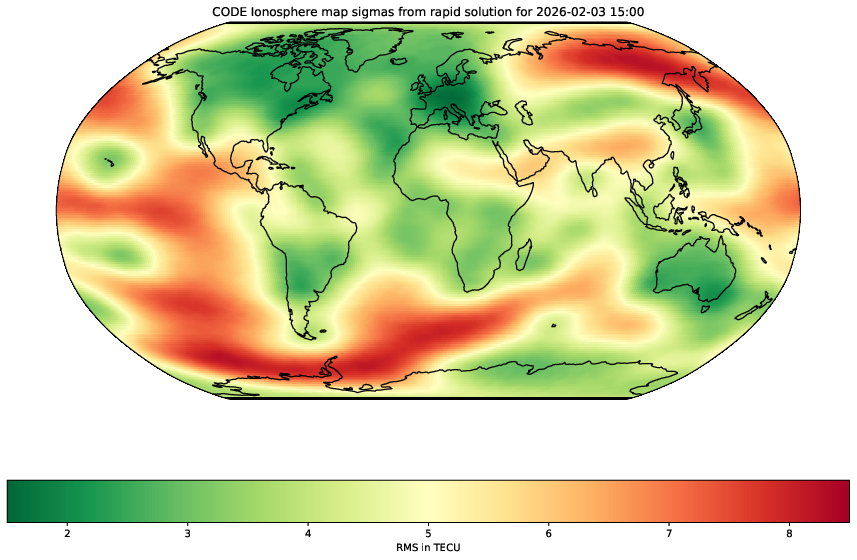
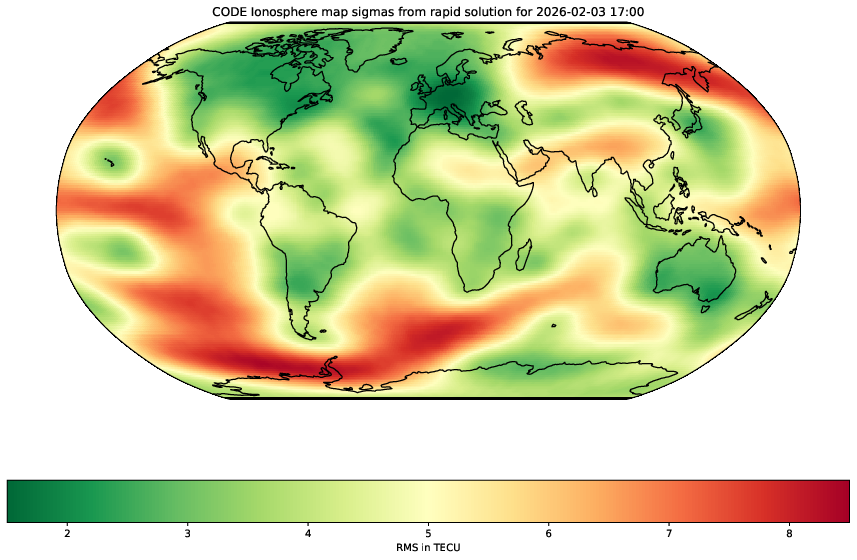
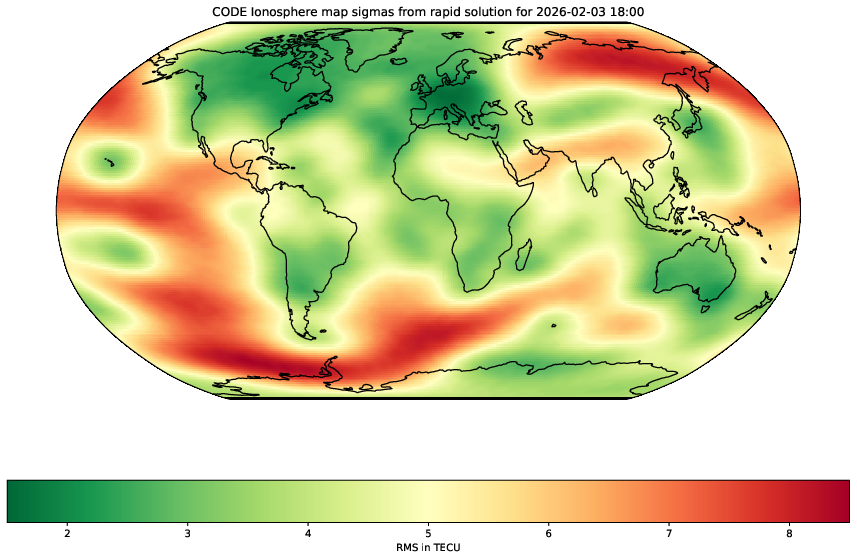
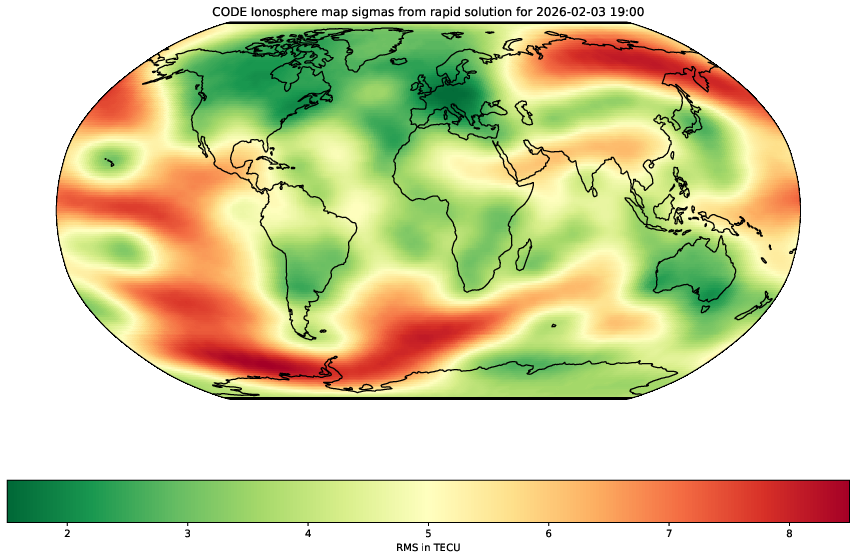
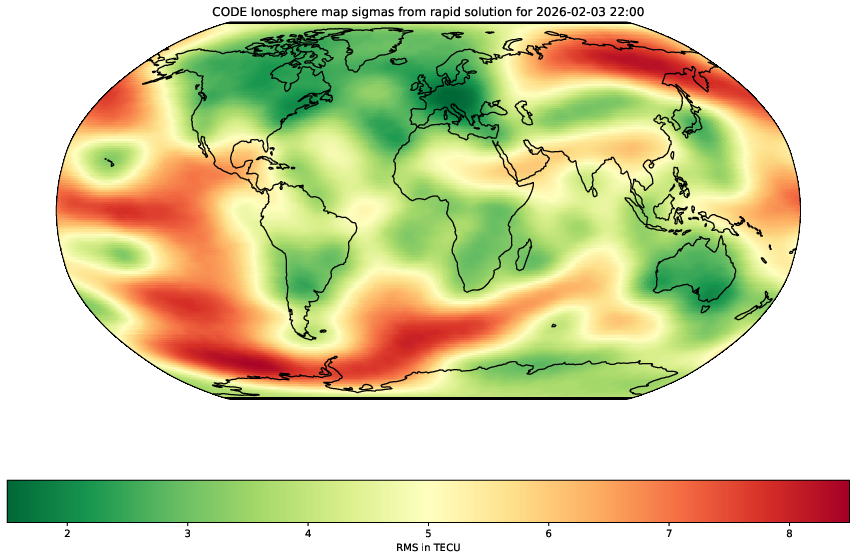
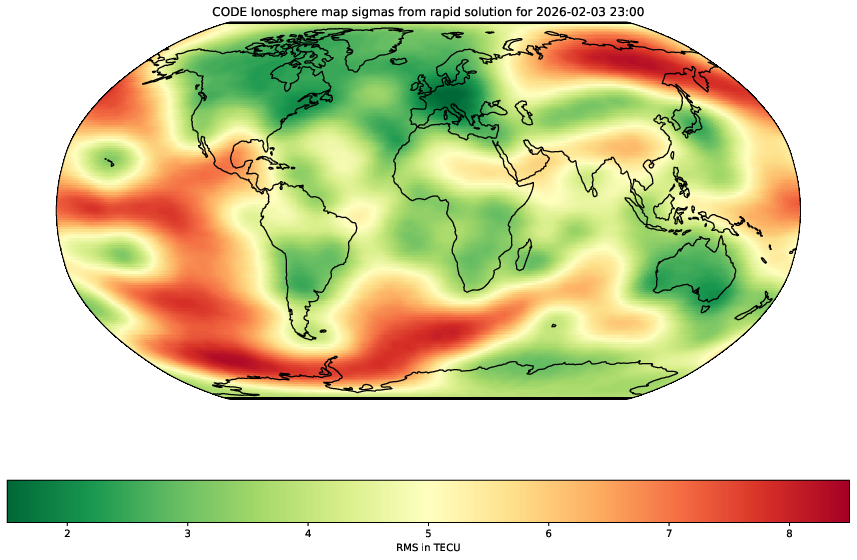
Ionosphere maps - rapid: sigma values (00:00-24:00)

|

|
|

|

|

|

|

|

|
|

|
|

|
|
|
|

|
|
|
|

|

|
|
|

|
Ionosphere maps - rapid: animated GIFs -- one day (TEC values)

Ionosphere maps - rapid: animated GIFs -- one day (sigma values)
Ionosphere maps - rapid: animated GIFs -- three days (TEC values)
Ionosphere maps - rapid: MP4 animation
|
|
Comparison final/rapid solution: animated GIF (TEC values)
Comparison final/rapid solution: animated GIF (sigma values)
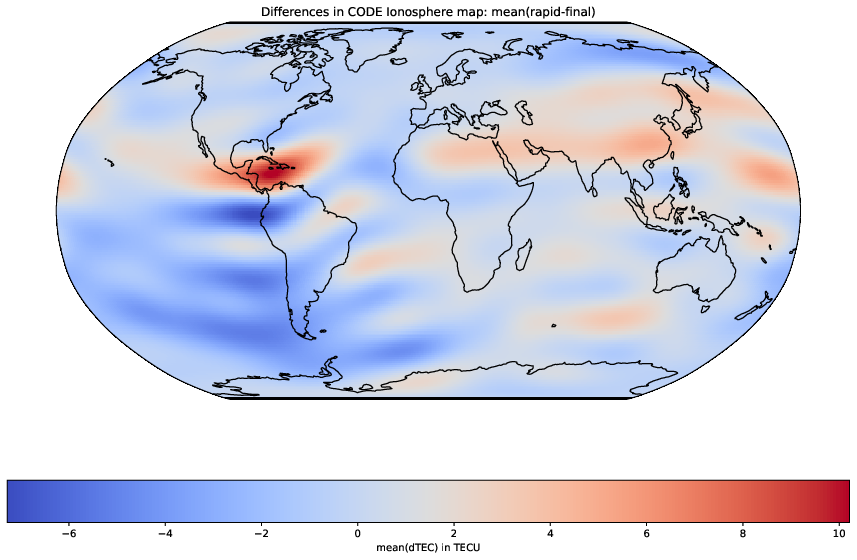
Comparison final/rapid solution: mean(TEC values)
Date:
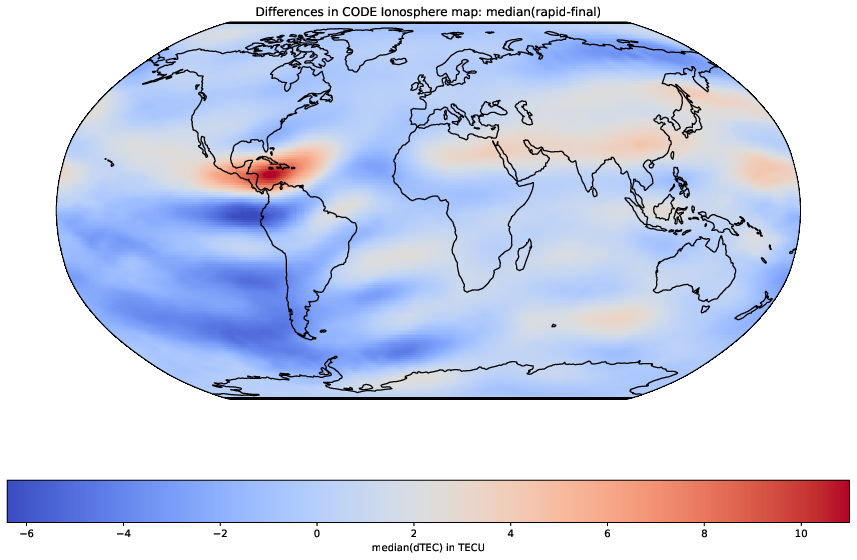
Comparison final/rapid solution: median(TEC values)
Date:
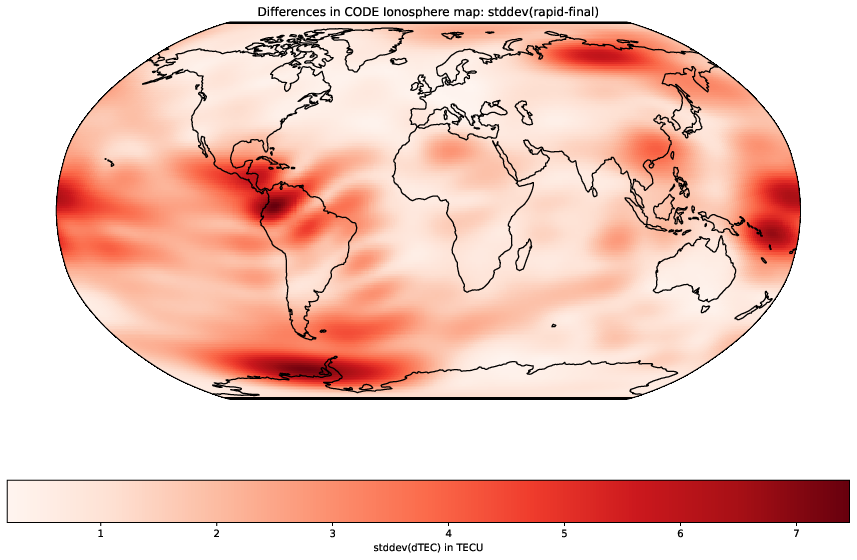
Comparison final/rapid solution: std.dev(TEC values)
Date:
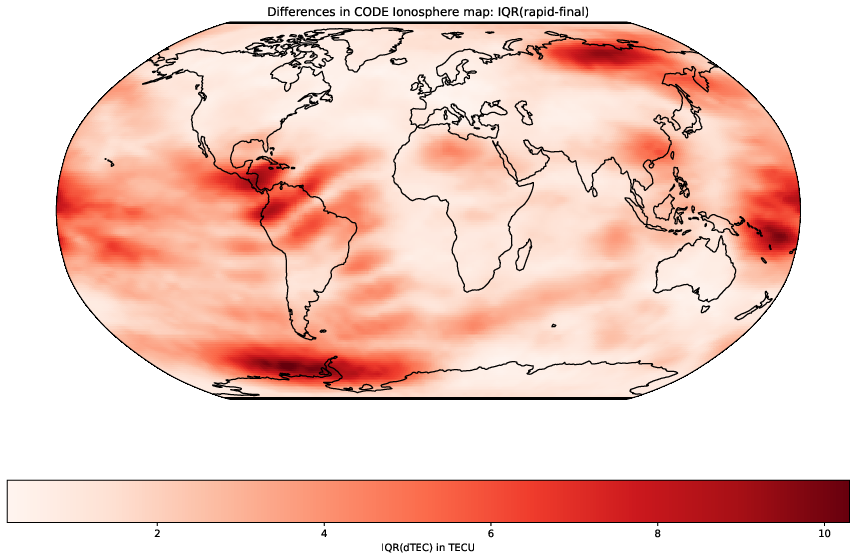
Comparison final/rapid solution: IQR(TEC values)
Date:
|
|
Historical Iono Event: High activity May 9-12, 2024 (visible auroras across Europe)
|
|
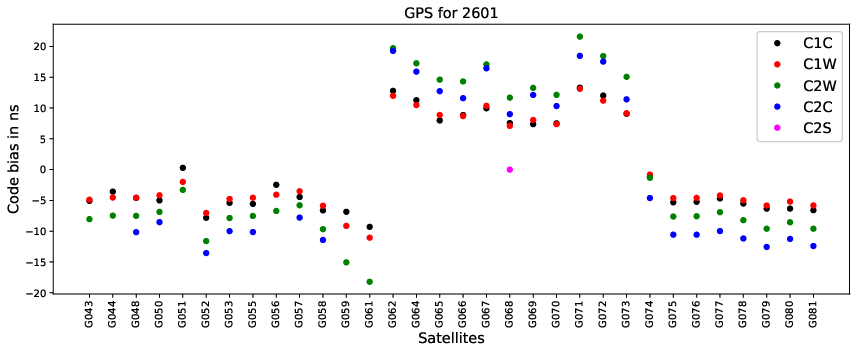
Monthly mean OSBs: GPS
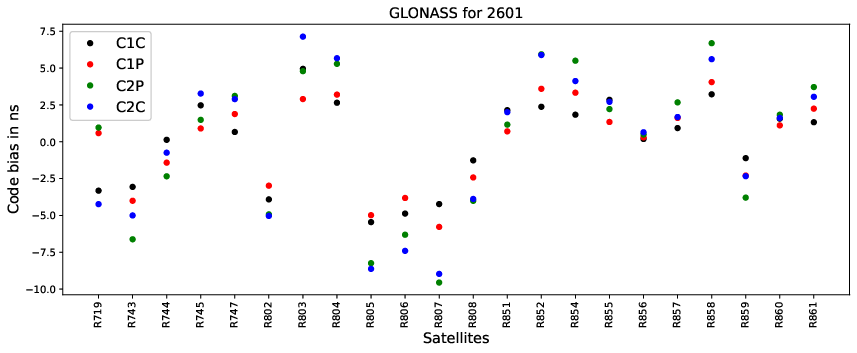
Monthly mean OSBs: GLO
Monthly mean OSBs: GAL
|
|